Chapter 12 Mini Case
Hatfield Medical Supplies’s stock price had been lagging its industry averages, so its board of directors brought in a
new CEO, Jaiden Lee. Lee had brought in Ashley Novak, a finance MBA who had been working for a consulting
company, to replace the old CFO, and Lee asked Ashley to develop the financial planning section of the strategic plan.
In her previous job, Novak’s primary task had been to help clients develop financial forecasts, and that was one
reason Lee hired her.
Novak began as she always did, by comparing Hatfield’s financial ratios to the industry averages. If any ratio was
substandard, she discussed it with the responsible manager to see what could be done to improve the situation. The
following data shows Hatfield’s latest financial statements plus some ratios and other data that Novak plans to use in
her analysis.
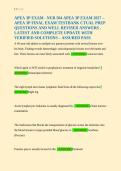
Hatfield Medical Supplies: Balance Sheet (Millions of Hatfield Medical Supplies: Income Statement
Dollars), 12/31/2013 (Millions of Dollars Except per Share)
Cash $20 Sales
Accts. rec. $280 Op. costs (excl. depr.)
Inventories $400 Depreciation
Total CA $700 EBIT
Net fixed assets $500 Interest
Total assets $1,200 Pretax earnings
Taxes (40%)
Accts. pay. & accruals $80 Net income
Line of credit $0
Total CL $80 Dividends
Long-term debt $500 Add. to RE
Total liabilities $580 Common shares
Common stock $420 EPS
Retained earnings $200 DPS
Total common equ. $620 Ending stock price
Total liab. & equity $1,200
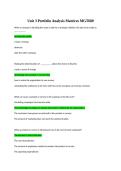
Selected Ratios and Other Data, 2013
Hatfield Industry
Op. costs/Sales 90% 88% Total liability/Total assets
Depr./FA 10% 12% Times interest earned
Cash/Sales 1% 1% Return on assets (ROA)
Receivables/Sales 14% 11% Profit margin (M)
Inventories/Sales 20% 15% Sales/Assets
Fixed assets/Sales 25% 22% Assets/Equity
Acc. pay. & accr. / Sales 4% 4% Return on equity (ROE)
Tax rate 40% 40% P/E ratio
ROIC 8.0% 12.5%
NOPAT/Sales 4.5% 5.6%
,Total op. capital/Sales 56.0% 45.0%
Additional Data 2014
Exp. Saled growth rate 10%
Interest rate on LT debt 8%
Target WACC 9%
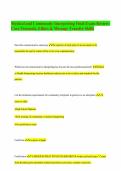
a. Using Hatfield’s data and its industry averages, how well run would you say Hatfield appears to be in comparison
with other firms in its industry? What are its primary strengths and weaknesses? Be specific in your answer, and
point to various ratios that support your position. Also, use the Du Pont equation (see Chapter 3) as one part of your
analysis.
Hatfield is less profitable, uses its assets less efficiently, and has too much leverage.
Du Pont ROE M x Sales/Assets x Assets/Equity =
Hatfield 3.30% 1.67 1.94 =
Industry 4.99% 2.04 1.58 =
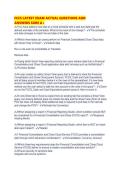
b. Use the AFN equation to estimate Hatfield’s required new external capital for 2014 if the sale growth rate is 10%.
Assume that the firm’s 2013 ratios will remain the same in 2014. (Hint: Hatfield was operating at full capacity in
2013.)
Data for AFN Method
Growth rate in sales (g) 10%
Sales (S0) $2,000
Forecasted sales (S1) $2,200
Increase in sales (ΔS = gS0) $200
Profit margin (M) 3.30%
Assets/Sales (A0*/S0) 60.0%
Payout ratio (POR) 30.3%
Spont. Liab./Sales (L0*/S0) 4.0%
Spontaneous
AFNHatfield = Add'l Req'd Assets − liabilities
−
= (A0*/S0)∆S − (L0*/S0)∆S −
= $120.0 − $8.0 −
AFNHatfield = $61.40 million
c. Define the term capital intensity. Explain how a decline in capital intensity would affect the AFN, other things held
constant. Would economies of scale combined with rapid growth affect capital intensity, other things held constant?
Also, explain how changes in each of the following would affect AFN, holding other things constant: the growth rate,
the amount of accounts payable, the profit margin, and the payout ratio.
, Answer: See PowerPoint Show
d. Define the term self-supporting growth rate. What is Hatfield’s self-supporting growth rate? Would the self-
supporting growth rate be affected by a change in the capital intensity ratio or the other factors mentioned in the
previous question? Other things held constant, would the calculated capital intensity ratio change over time if the
company were growing and were also subject to economies of scale and/or lumpy assets
Self-Supporting Growth Rate. This is the maximum growth rate that can be attained without raising external funds,
i.e., the value of g that forces AFN = 0, holding other things constant. We found this rate, ith Excel's Goal Seek function
and also algebraically, as explained below.
1. Using algebra. The self-supporting growth rate can also be found by setting the AFN equation to zero and then
solving for g.
M(1 – POR)(S0)
Self-Supporting g = = ───────────────────
A0* – L0* – M(1 – POR)S0
M= 3.30%
POR = 30.3%
1-POR = 69.7%
S0 = $2,000
A* = $1,200
L* = $80
M(1 – POR)(S0) $46.00
Self-Supporting g = ─────────────────── = ──────── =
A0* – L0* – M(1 – POR)S0 $1,074.00
2. Using Goal Seek. To find the self-supporting growth rate with Goal Seek, select Data, What-If Analysis, and Goal
Seek; then choose cell B91 as the value for the "Set Cell" area of the Goal Seek dialog box, choose 0 as the value for the
"To Value" area of the dialog box, and choose cell C54 as the value for the "By Changing Cell" area of the dialog box.
Then hit OK.
e. Use the following assumptions to answer the questions below: (1) Operating ratios remain unchanged. (2) Sales
will grow by 10%, 8%, 5%, and 5% for the next four years. (3) The target weighted average cost of capital (WACC) is
9%. This is the No Change scenario because operations remain unchanged.
Hatfield Medical Supplies’s stock price had been lagging its industry averages, so its board of directors brought in a
new CEO, Jaiden Lee. Lee had brought in Ashley Novak, a finance MBA who had been working for a consulting
company, to replace the old CFO, and Lee asked Ashley to develop the financial planning section of the strategic plan.
In her previous job, Novak’s primary task had been to help clients develop financial forecasts, and that was one
reason Lee hired her.
Novak began as she always did, by comparing Hatfield’s financial ratios to the industry averages. If any ratio was
substandard, she discussed it with the responsible manager to see what could be done to improve the situation. The
following data shows Hatfield’s latest financial statements plus some ratios and other data that Novak plans to use in
her analysis.
Hatfield Medical Supplies: Balance Sheet (Millions of Hatfield Medical Supplies: Income Statement
Dollars), 12/31/2013 (Millions of Dollars Except per Share)
Cash $20 Sales
Accts. rec. $280 Op. costs (excl. depr.)
Inventories $400 Depreciation
Total CA $700 EBIT
Net fixed assets $500 Interest
Total assets $1,200 Pretax earnings
Taxes (40%)
Accts. pay. & accruals $80 Net income
Line of credit $0
Total CL $80 Dividends
Long-term debt $500 Add. to RE
Total liabilities $580 Common shares
Common stock $420 EPS
Retained earnings $200 DPS
Total common equ. $620 Ending stock price
Total liab. & equity $1,200
Selected Ratios and Other Data, 2013
Hatfield Industry
Op. costs/Sales 90% 88% Total liability/Total assets
Depr./FA 10% 12% Times interest earned
Cash/Sales 1% 1% Return on assets (ROA)
Receivables/Sales 14% 11% Profit margin (M)
Inventories/Sales 20% 15% Sales/Assets
Fixed assets/Sales 25% 22% Assets/Equity
Acc. pay. & accr. / Sales 4% 4% Return on equity (ROE)
Tax rate 40% 40% P/E ratio
ROIC 8.0% 12.5%
NOPAT/Sales 4.5% 5.6%
,Total op. capital/Sales 56.0% 45.0%
Additional Data 2014
Exp. Saled growth rate 10%
Interest rate on LT debt 8%
Target WACC 9%
a. Using Hatfield’s data and its industry averages, how well run would you say Hatfield appears to be in comparison
with other firms in its industry? What are its primary strengths and weaknesses? Be specific in your answer, and
point to various ratios that support your position. Also, use the Du Pont equation (see Chapter 3) as one part of your
analysis.
Hatfield is less profitable, uses its assets less efficiently, and has too much leverage.
Du Pont ROE M x Sales/Assets x Assets/Equity =
Hatfield 3.30% 1.67 1.94 =
Industry 4.99% 2.04 1.58 =
b. Use the AFN equation to estimate Hatfield’s required new external capital for 2014 if the sale growth rate is 10%.
Assume that the firm’s 2013 ratios will remain the same in 2014. (Hint: Hatfield was operating at full capacity in
2013.)
Data for AFN Method
Growth rate in sales (g) 10%
Sales (S0) $2,000
Forecasted sales (S1) $2,200
Increase in sales (ΔS = gS0) $200
Profit margin (M) 3.30%
Assets/Sales (A0*/S0) 60.0%
Payout ratio (POR) 30.3%
Spont. Liab./Sales (L0*/S0) 4.0%
Spontaneous
AFNHatfield = Add'l Req'd Assets − liabilities
−
= (A0*/S0)∆S − (L0*/S0)∆S −
= $120.0 − $8.0 −
AFNHatfield = $61.40 million
c. Define the term capital intensity. Explain how a decline in capital intensity would affect the AFN, other things held
constant. Would economies of scale combined with rapid growth affect capital intensity, other things held constant?
Also, explain how changes in each of the following would affect AFN, holding other things constant: the growth rate,
the amount of accounts payable, the profit margin, and the payout ratio.
, Answer: See PowerPoint Show
d. Define the term self-supporting growth rate. What is Hatfield’s self-supporting growth rate? Would the self-
supporting growth rate be affected by a change in the capital intensity ratio or the other factors mentioned in the
previous question? Other things held constant, would the calculated capital intensity ratio change over time if the
company were growing and were also subject to economies of scale and/or lumpy assets
Self-Supporting Growth Rate. This is the maximum growth rate that can be attained without raising external funds,
i.e., the value of g that forces AFN = 0, holding other things constant. We found this rate, ith Excel's Goal Seek function
and also algebraically, as explained below.
1. Using algebra. The self-supporting growth rate can also be found by setting the AFN equation to zero and then
solving for g.
M(1 – POR)(S0)
Self-Supporting g = = ───────────────────
A0* – L0* – M(1 – POR)S0
M= 3.30%
POR = 30.3%
1-POR = 69.7%
S0 = $2,000
A* = $1,200
L* = $80
M(1 – POR)(S0) $46.00
Self-Supporting g = ─────────────────── = ──────── =
A0* – L0* – M(1 – POR)S0 $1,074.00
2. Using Goal Seek. To find the self-supporting growth rate with Goal Seek, select Data, What-If Analysis, and Goal
Seek; then choose cell B91 as the value for the "Set Cell" area of the Goal Seek dialog box, choose 0 as the value for the
"To Value" area of the dialog box, and choose cell C54 as the value for the "By Changing Cell" area of the dialog box.
Then hit OK.
e. Use the following assumptions to answer the questions below: (1) Operating ratios remain unchanged. (2) Sales
will grow by 10%, 8%, 5%, and 5% for the next four years. (3) The target weighted average cost of capital (WACC) is
9%. This is the No Change scenario because operations remain unchanged.