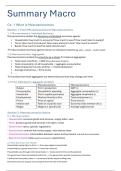
Summary Macro
Ch. 1 What is Macroeconomics
Section 1: From Microeconomics to Macroeconomics
1.1 Microeconomics: Individual decisions
Microeconomics studies the decisions of individual economic agents:
• Households: how much to consume? How much to save? How much labor to supply?
• Firms: How much to produce? How many workers to hire? How much to invest?
• Banks: How much to lend? At what interest rate?
à It also studies how these agents interact in individual markets (eg. labor -, goods -, credit market)
1.2 Macroeconomics: Aggregates
Macroeconomics studies the economy as a whole à it looks at aggregates:
• Total input of all firms -> GDP (Gross Domestic Product)
• Total consumption of all households -> aggregate consumption
• Total employment across all firms -> Total employment
• Average of all prices -> Price levels
• …
à It studies how these aggregates are determined and how they change over time
1.3 From individual to aggregate variables
Microeconomics Macroeconomics
Output Firm’s production GDP (Y)
Consumption Household’s spending Aggregate consumption (C)
Investment Firm’s capital purchases Aggregate investment (I)
Employement Workers hired by a firm Total employment (L)
Prices Price of a good Price level (P)
Interest rate Rate on a specific loan Economy-wide interest rate (i)
Wages Wage at a specific job Average wage level (W)
Section 2: Macroeconomics Actors
2.1 The main actors
- Households: consume goods and services, supply labor, save
- Firms: produce goods and services, hire labor, invest
- Government: taxes, spends, regulations
- Central bank: controls the money supply, sets interest rates
- Commercial banks: intermediate between savers and borrowers, link with the central bank
- Rest of the world: trade (export and import), capital flows
2.2 How the actors are related
Households supply labor to firms <-> firms pay wages to households
Households buy goods from firms <-> firms earn revenue
Households save through commercial banks <-> banks lend to firms and households
The government taxes households and firms <-> the government spends on goods and transfers
Central bank sets policy rates <-> commercial banks adjust lending rates
Domestic economy exports to and imports from the rest of the world
,Ch. 2 GDP and the measurement of progress
Section 1: What is GDP
1.1 Definition of GDP
Def. Gross Domestic Product (GDP): the market value of all finished goods and services produced
within a country in a year
GDP/ Capita = GDP/Population
- GDP measures total output, incl. different goods & services with different values
ð Price * Quantity = Market Value -> you add all the market values of each good to get GDP
Finished goods: sold to final users and then consumed
Intermediate goods: sold to firms for further processing
- If we count intermediate goods, we will count double à only count final goods in GDP
(à exception: machinery and equipment are finished goods even though they help produce other goods)
Goods: tangible products (eg. cars, food, computers, …)
Services: benefits without tangible output (eg, healthcare, haircut, consulting, …)
à today: services account for nearly 80% of U.S. GDP
- GDP measures current production, not sales of existing assets
Not included in GDP:
• Sales of used goods (eg. used cars, …)
• Sales of old houses
• Sales of stocks and bonds (these are financial assets, not produced goods)
However: services of real estate agents, used-car salespeople, and brokers are included (their services
are produced in the current year)
- GDP measures production by labor and capital located within the country
GDP ≈ GNP (large nations)
GDP: production within a country’s border
GNP: production by a country’s residents, wherever located
- GDP measures annual production (a flow), not accumulated wealth (a stock)
Analogy: GDP is like annual wages; national wealth is like total savings
- GDP is calculated quarterly by the Bureau of Economic Analysis (BEA)
Section 2: Growth rates
GDP growth rate = percentage change from one year to the next
!"# %&'(!"# )%*+&&+&*
Growth rate = !"#) %*+&&+&*
× 100
à This percentage is the growth rate of nominal GDP
!"
à Rule of 70: If the annual growth rate of a variable is X%, then the doubling time is #
years
(à ge deelt 70 door % v/d growth rate dit is na hoeveel jaar de GDP verdubbeld is)
,Section 3: Nominal vs. real GDP
Nominal: calculated using prices at the time of sales, not adjusted for changes in prices
à when comparing GDP across years, changes reflect both:
• Changes in output (more products, …)
• Changes in prices (inflation)
Real: calculated using constant prices (prices from a base year), adjusted for changes in prices by using
the same set of prices in all time periods à removes the effect of price changes
GDP deflator: price index that measures inflation
$%&'()* ,-.
GDP deflator: /0)* ,-.
× 100
Section 4: Cyclical and short-run changes in GDP
à GDP is used to measure short-run fluctuations in an economy
Def. Business Cycles: fluctuations of real GDP around its long-term trend
Incl.: recessions: widespread decline in real GDP, negative growth rate, lasts several months
expansions (boom, real GDP grows faster than nominal)
Data revision:
GDP estimates are released about one month after each quarter; those estimates are revised in the
following months, and significant revisions can occur years later
Section 5: The many ways of splitting GDP(=Y)
Economists split GDP into different ways depending on the question:
• Nanional spending approach: Y = C + I + G + NX (à focus + analyses short-run)
• Factor income approach: Y = wages + rent + interest + profit
Consumption (C): private spending on finished goods and services, (eg. cars, food, healthcare, education, …)
à largest component of GDP
Investment (I): mostly businesses, private spending on tools, plant, and equipment used to produce
future output, (eg. machinery, factories, new home construction, changes in inventories)
Government purchases (G): spending by all levels of government on finished goods and services,
(eg. tanks, roads, government employee wages)
Net export (NX): NX = exports – imports
Exports: goods produced domestically, purchased by foreigners
Imports: goods produced abroad, purchased domestically
, Section 6: Problems with GDP as a measure of output and welfare
1) The underground economy
Illegal transactions (drugs, duped goods, …), legal goods sold “under the table” to avoid taxes,
-> More prevalent in countries with high corruption/taxes
-> Some countries seem poor, but aren’t necessarily they just have an underground economy
2) Nonpriced production
Home production (cooking, cleaning,…), volunteer work, free digital services (YouTube, Google,…)
3) Environmental costs
GDP adds goods but doesn’t subtract “bads”. (“bads” eg. pollution, crime, …)
4) Health and longevity
GDP doesn’t capture improvements in health, but does increase in life expectancy
Ch. 3 The wealth of nations and economic growth
Section 1: Why economic growth matters
Economic growth is crucial for saving lives. Over 1 million people die each year from diarrhea, but
these deaths can be prevented without new scientific discoveries. Improvements driven by economic
growth, such as clean water, …, can significantly reduce mortality
à strong correlation between GDP per capita and (infant) survival/ health
à wealth correlates with almost every indicator of well-being: nutrition, education, wars, life expectancy, …
Section 2: Key facts about the wealth of nations
Fact 1: GDP per capita varies enormously among nations
- ~ 10% of the world’s population lives in a country with a GDP per capita < $4.000
- ~ 70% “ “ “ “ “ ≥ $14.000
- 76% “ “ “ “ “ below the world average
Fact 2: Everyone used to be poor
For most of human history, people everywhere were equally poor, with GDP per capita around $700-
$1,000 (in today’s terms). This level stayed nearly unchanged for thousands of years, meaning there was
essentially no long-term economic growth.
Fact 3: Growth miracles and growth disasters
The U.S. became wealthy by growing slowly but consistently à other countries can catch up quickly
Growth miracle: (eg. Japan)
After WWII Japan was one of the poorest countries in the world, from 1950-1970 Japan grew at
8,5% per year, Japan’s GDP doubled in ~ 8years
àToday Japan is one of the richest countries in the world
Growth disaster: (eg. Nigeria)
Nigeria has barely grown since 1950, and was poorer in 2005 than in 1974, High oil prices
briefly bumped up GDP/capita in 1974 but they weren’t sustained
Ch. 1 What is Macroeconomics
Section 1: From Microeconomics to Macroeconomics
1.1 Microeconomics: Individual decisions
Microeconomics studies the decisions of individual economic agents:
• Households: how much to consume? How much to save? How much labor to supply?
• Firms: How much to produce? How many workers to hire? How much to invest?
• Banks: How much to lend? At what interest rate?
à It also studies how these agents interact in individual markets (eg. labor -, goods -, credit market)
1.2 Macroeconomics: Aggregates
Macroeconomics studies the economy as a whole à it looks at aggregates:
• Total input of all firms -> GDP (Gross Domestic Product)
• Total consumption of all households -> aggregate consumption
• Total employment across all firms -> Total employment
• Average of all prices -> Price levels
• …
à It studies how these aggregates are determined and how they change over time
1.3 From individual to aggregate variables
Microeconomics Macroeconomics
Output Firm’s production GDP (Y)
Consumption Household’s spending Aggregate consumption (C)
Investment Firm’s capital purchases Aggregate investment (I)
Employement Workers hired by a firm Total employment (L)
Prices Price of a good Price level (P)
Interest rate Rate on a specific loan Economy-wide interest rate (i)
Wages Wage at a specific job Average wage level (W)
Section 2: Macroeconomics Actors
2.1 The main actors
- Households: consume goods and services, supply labor, save
- Firms: produce goods and services, hire labor, invest
- Government: taxes, spends, regulations
- Central bank: controls the money supply, sets interest rates
- Commercial banks: intermediate between savers and borrowers, link with the central bank
- Rest of the world: trade (export and import), capital flows
2.2 How the actors are related
Households supply labor to firms <-> firms pay wages to households
Households buy goods from firms <-> firms earn revenue
Households save through commercial banks <-> banks lend to firms and households
The government taxes households and firms <-> the government spends on goods and transfers
Central bank sets policy rates <-> commercial banks adjust lending rates
Domestic economy exports to and imports from the rest of the world
,Ch. 2 GDP and the measurement of progress
Section 1: What is GDP
1.1 Definition of GDP
Def. Gross Domestic Product (GDP): the market value of all finished goods and services produced
within a country in a year
GDP/ Capita = GDP/Population
- GDP measures total output, incl. different goods & services with different values
ð Price * Quantity = Market Value -> you add all the market values of each good to get GDP
Finished goods: sold to final users and then consumed
Intermediate goods: sold to firms for further processing
- If we count intermediate goods, we will count double à only count final goods in GDP
(à exception: machinery and equipment are finished goods even though they help produce other goods)
Goods: tangible products (eg. cars, food, computers, …)
Services: benefits without tangible output (eg, healthcare, haircut, consulting, …)
à today: services account for nearly 80% of U.S. GDP
- GDP measures current production, not sales of existing assets
Not included in GDP:
• Sales of used goods (eg. used cars, …)
• Sales of old houses
• Sales of stocks and bonds (these are financial assets, not produced goods)
However: services of real estate agents, used-car salespeople, and brokers are included (their services
are produced in the current year)
- GDP measures production by labor and capital located within the country
GDP ≈ GNP (large nations)
GDP: production within a country’s border
GNP: production by a country’s residents, wherever located
- GDP measures annual production (a flow), not accumulated wealth (a stock)
Analogy: GDP is like annual wages; national wealth is like total savings
- GDP is calculated quarterly by the Bureau of Economic Analysis (BEA)
Section 2: Growth rates
GDP growth rate = percentage change from one year to the next
!"# %&'(!"# )%*+&&+&*
Growth rate = !"#) %*+&&+&*
× 100
à This percentage is the growth rate of nominal GDP
!"
à Rule of 70: If the annual growth rate of a variable is X%, then the doubling time is #
years
(à ge deelt 70 door % v/d growth rate dit is na hoeveel jaar de GDP verdubbeld is)
,Section 3: Nominal vs. real GDP
Nominal: calculated using prices at the time of sales, not adjusted for changes in prices
à when comparing GDP across years, changes reflect both:
• Changes in output (more products, …)
• Changes in prices (inflation)
Real: calculated using constant prices (prices from a base year), adjusted for changes in prices by using
the same set of prices in all time periods à removes the effect of price changes
GDP deflator: price index that measures inflation
$%&'()* ,-.
GDP deflator: /0)* ,-.
× 100
Section 4: Cyclical and short-run changes in GDP
à GDP is used to measure short-run fluctuations in an economy
Def. Business Cycles: fluctuations of real GDP around its long-term trend
Incl.: recessions: widespread decline in real GDP, negative growth rate, lasts several months
expansions (boom, real GDP grows faster than nominal)
Data revision:
GDP estimates are released about one month after each quarter; those estimates are revised in the
following months, and significant revisions can occur years later
Section 5: The many ways of splitting GDP(=Y)
Economists split GDP into different ways depending on the question:
• Nanional spending approach: Y = C + I + G + NX (à focus + analyses short-run)
• Factor income approach: Y = wages + rent + interest + profit
Consumption (C): private spending on finished goods and services, (eg. cars, food, healthcare, education, …)
à largest component of GDP
Investment (I): mostly businesses, private spending on tools, plant, and equipment used to produce
future output, (eg. machinery, factories, new home construction, changes in inventories)
Government purchases (G): spending by all levels of government on finished goods and services,
(eg. tanks, roads, government employee wages)
Net export (NX): NX = exports – imports
Exports: goods produced domestically, purchased by foreigners
Imports: goods produced abroad, purchased domestically
, Section 6: Problems with GDP as a measure of output and welfare
1) The underground economy
Illegal transactions (drugs, duped goods, …), legal goods sold “under the table” to avoid taxes,
-> More prevalent in countries with high corruption/taxes
-> Some countries seem poor, but aren’t necessarily they just have an underground economy
2) Nonpriced production
Home production (cooking, cleaning,…), volunteer work, free digital services (YouTube, Google,…)
3) Environmental costs
GDP adds goods but doesn’t subtract “bads”. (“bads” eg. pollution, crime, …)
4) Health and longevity
GDP doesn’t capture improvements in health, but does increase in life expectancy
Ch. 3 The wealth of nations and economic growth
Section 1: Why economic growth matters
Economic growth is crucial for saving lives. Over 1 million people die each year from diarrhea, but
these deaths can be prevented without new scientific discoveries. Improvements driven by economic
growth, such as clean water, …, can significantly reduce mortality
à strong correlation between GDP per capita and (infant) survival/ health
à wealth correlates with almost every indicator of well-being: nutrition, education, wars, life expectancy, …
Section 2: Key facts about the wealth of nations
Fact 1: GDP per capita varies enormously among nations
- ~ 10% of the world’s population lives in a country with a GDP per capita < $4.000
- ~ 70% “ “ “ “ “ ≥ $14.000
- 76% “ “ “ “ “ below the world average
Fact 2: Everyone used to be poor
For most of human history, people everywhere were equally poor, with GDP per capita around $700-
$1,000 (in today’s terms). This level stayed nearly unchanged for thousands of years, meaning there was
essentially no long-term economic growth.
Fact 3: Growth miracles and growth disasters
The U.S. became wealthy by growing slowly but consistently à other countries can catch up quickly
Growth miracle: (eg. Japan)
After WWII Japan was one of the poorest countries in the world, from 1950-1970 Japan grew at
8,5% per year, Japan’s GDP doubled in ~ 8years
àToday Japan is one of the richest countries in the world
Growth disaster: (eg. Nigeria)
Nigeria has barely grown since 1950, and was poorer in 2005 than in 1974, High oil prices
briefly bumped up GDP/capita in 1974 but they weren’t sustained