6/11/25, 10:51 AM Module 2 Problem Set: Statistics - Zamboni - 2025E
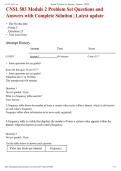
CNSL 503 Module 2 Problem Set Questions and
Answers with Complete Solution | Latest update
• Due No due date
, Points 5
, Questions 23
• Time Limit None
Attempt History
Attempt Time Score
LATEST Attempt 1 654 minutes O out of 5 *
• Some questions not yet graded
Score for this quiz: O out of 5 *
• Some questions not yet graded
Submitted Jun 11 at 10:49am
This attempt took 654 minutes.
Question 1
Not yet graded / O pts
What is a frequency table used for?
Your Answer:
A frequency table shows the number of times a certain value occurs within a dataset, which is also known
as each value's frequency.
Frequency tables allow information to be more easily organized.
A frequency table is a table that displays the number of times a certain value appears within the
dataset, otherwise known as each value's frequency.
Question 2
Not yet graded / O pts
Use the table below to answer each question.
Pulse rate (beats per minute) Frequency
https://portagelearning.instructure.com/courses/2637/quizzes/60426 1/12
, 6/11/25, 10:51 AM Module 2 Problem Set: Statistics - Zamboni - 2025E
50-59 17
60-69 70- 33
79 41
80-89 37
90—99 13
100-109 4
1. How many participants are represented in the frequency table?
2. How many categories are in the frequency table?
3. How many participants had a pulse rate between 90-99?
Your Answer:
1. Participants- 145
2. Categories- 6
3. Pulse Rate - 13
1. 145; Feedback: Calculate the sum of values in the frequency column.
2. 6
3. 13
Question 3
Not yet graded / O pts
The number of daily births at a New York hospital were totaled each day for one week (Monday through
Sunday) with the following frequencies: 52, 66, 72, 57, 57, 43, 53.
Construct a frequency table with a column for relative frequencies given as percentages.
Your Answer:
DAY FREQUENCY
MONDAY 62
TUESDAY 66
WEDNESDAY 72
THURSDAY 57
FRI DAY 57
SATURDAY 43
https://portagelearning.instructure.com/courses/2637/quizzes/60426 2/12
CNSL 503 Module 2 Problem Set Questions and
Answers with Complete Solution | Latest update
• Due No due date
, Points 5
, Questions 23
• Time Limit None
Attempt History
Attempt Time Score
LATEST Attempt 1 654 minutes O out of 5 *
• Some questions not yet graded
Score for this quiz: O out of 5 *
• Some questions not yet graded
Submitted Jun 11 at 10:49am
This attempt took 654 minutes.
Question 1
Not yet graded / O pts
What is a frequency table used for?
Your Answer:
A frequency table shows the number of times a certain value occurs within a dataset, which is also known
as each value's frequency.
Frequency tables allow information to be more easily organized.
A frequency table is a table that displays the number of times a certain value appears within the
dataset, otherwise known as each value's frequency.
Question 2
Not yet graded / O pts
Use the table below to answer each question.
Pulse rate (beats per minute) Frequency
https://portagelearning.instructure.com/courses/2637/quizzes/60426 1/12
, 6/11/25, 10:51 AM Module 2 Problem Set: Statistics - Zamboni - 2025E
50-59 17
60-69 70- 33
79 41
80-89 37
90—99 13
100-109 4
1. How many participants are represented in the frequency table?
2. How many categories are in the frequency table?
3. How many participants had a pulse rate between 90-99?
Your Answer:
1. Participants- 145
2. Categories- 6
3. Pulse Rate - 13
1. 145; Feedback: Calculate the sum of values in the frequency column.
2. 6
3. 13
Question 3
Not yet graded / O pts
The number of daily births at a New York hospital were totaled each day for one week (Monday through
Sunday) with the following frequencies: 52, 66, 72, 57, 57, 43, 53.
Construct a frequency table with a column for relative frequencies given as percentages.
Your Answer:
DAY FREQUENCY
MONDAY 62
TUESDAY 66
WEDNESDAY 72
THURSDAY 57
FRI DAY 57
SATURDAY 43
https://portagelearning.instructure.com/courses/2637/quizzes/60426 2/12