WCO4 beschrijvende statistiek – kruistabellen en het correlatievraagstuk
Thema 9 – analyse van de kruistabel (bivariate statistiek)
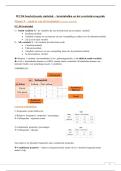
9.1) De kruistabel
1) Onafh variabele X = de variabele die een invloed heeft op een andere variabele
• Predictorvariabele
• Variabele waarop we ons baseren om een voorspelling te maken over de uitkomstvariabele
• Zet je in de rijen vd tabel
2) Afh variabele Y = de variabele die beïnvloed wordt
• Criteriumvariabele
• Uitkomstvariabele
• Variabele waarvoor we een voorspelling doen obv de predictorvariabele
• In de kolommen vd tabel
➔ Wanneer 1 variabele onveranderbaar is (bv. geboortegeslacht), is dit altijd de onafh variabele.
➔ A.d.h.v. kruistabellen kunnen we GEEN causale relatie vaststellen. Kruistabellen kunnen een
indicatie bieden voor samenhang tussen 2 variabelen.
VOORBEELD:
3 soorten kruistabellen:
1) Frequenties (zoals hierboven)
2) Relatieve frequenties / proporties / percentages
→ Celfrequentie / algemeen totaal
3) Conditionele proporties /percentages
→ Celfrequentie / rijtotaal
Van relatieve (of absolute) frequenties naar conditionele proporties
→ Conditionele proportie = relatieve frequentie/totaal aantal vd rij (= absolute frequentie/totaal
aantal vd rij).
24
, Wanneer zijn kruistabellen geschikt?
1) 2 kwalitatieve variabelen op nominaal of ordinaal niveau
2) Kwantitatieve variabelen kunnen opgedeeld worden in categorieën + ze hebben een beperkt aantal
waarden
Thema 10 – het correlatievraagstuk
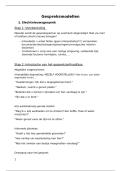
10.1) een spreidingsdiagram / scatterplot
Indien we 2 observaties hebben per respondent en deze v interval- of rationiveau zijn kunnen we de
samenhang onderzoeken adhv de correlatiecoëfficiënt (= maat voor lineaire samenhang).
• x-as = onafh variabele / predictorvariabele
• y-as = afh variabele / criteriumvariabele
Elk punt in het spreidingsdiagram = een gecombineerde score v een respondent. Deze punten vormen
de puntenwolk die het geheel v observaties visualiseren.
RICHTING STERKTE
Positieve richting gaat samen met:
- hoge score v X hangt samen met hoge
Bij een sterk verband vinden we een duidelijk
score v Y
lineair patroon terug in de puntenwolk. Het is
- lage score v X hangt samen met lage
een smalle puntenwolk.
score v Y
- Puntenwolk stijgt naar rechts
Negatieve richting gaat samen met:
- hoge score v X hangt samen met lage
Bij een zwak verband vinden we een minder
score v Y (inverse relatie)
duidelijk lineair patroon terug en zien we een
- lage score v X hangt samen met hoge
ronde of brede puntenwolk.
score v Y
- puntenwolk daalt naar rechts
10.2) Het begrip correlatie
Covariantie = de associatiemaat voor de mate v lineaire samenhang tussen 2 variabelen v interval- of
rationiveau.
𝟏
𝒄𝒐𝒗 ( 𝑿, 𝒀) = ∑(Xi − 𝑿) ∗ (Yi − 𝒀)
𝒏
➔ Producten vd afwijkingsscores v elke waarde tov het gem. voor beide variabelen worden opgeteld
• Sxy > 0 = positieve samenhang
• Sxy < 0 = negatieve samenhang
• Sxy = 0 = lineaire onafh / geen lineaire samenhang
Nadeel: de grootte hangt af v de meeteenheid waardoor het geen maat is voor de sterkte vh verband.
Pas vanaf 100 respondenten kan je ook uitspraken doen over de sterkte vh verband.
Correlatie = de associatiemaat voor de mate v lineaire samenhang tussen 2 variabelen v interval- of
rationiveau. De correlatie is de gestandaardiseerde covariantie → de covariantie wordt herschaald
zodat er geen afh is vd meeteenheden X en Y.
25
Thema 9 – analyse van de kruistabel (bivariate statistiek)
9.1) De kruistabel
1) Onafh variabele X = de variabele die een invloed heeft op een andere variabele
• Predictorvariabele
• Variabele waarop we ons baseren om een voorspelling te maken over de uitkomstvariabele
• Zet je in de rijen vd tabel
2) Afh variabele Y = de variabele die beïnvloed wordt
• Criteriumvariabele
• Uitkomstvariabele
• Variabele waarvoor we een voorspelling doen obv de predictorvariabele
• In de kolommen vd tabel
➔ Wanneer 1 variabele onveranderbaar is (bv. geboortegeslacht), is dit altijd de onafh variabele.
➔ A.d.h.v. kruistabellen kunnen we GEEN causale relatie vaststellen. Kruistabellen kunnen een
indicatie bieden voor samenhang tussen 2 variabelen.
VOORBEELD:
3 soorten kruistabellen:
1) Frequenties (zoals hierboven)
2) Relatieve frequenties / proporties / percentages
→ Celfrequentie / algemeen totaal
3) Conditionele proporties /percentages
→ Celfrequentie / rijtotaal
Van relatieve (of absolute) frequenties naar conditionele proporties
→ Conditionele proportie = relatieve frequentie/totaal aantal vd rij (= absolute frequentie/totaal
aantal vd rij).
24
, Wanneer zijn kruistabellen geschikt?
1) 2 kwalitatieve variabelen op nominaal of ordinaal niveau
2) Kwantitatieve variabelen kunnen opgedeeld worden in categorieën + ze hebben een beperkt aantal
waarden
Thema 10 – het correlatievraagstuk
10.1) een spreidingsdiagram / scatterplot
Indien we 2 observaties hebben per respondent en deze v interval- of rationiveau zijn kunnen we de
samenhang onderzoeken adhv de correlatiecoëfficiënt (= maat voor lineaire samenhang).
• x-as = onafh variabele / predictorvariabele
• y-as = afh variabele / criteriumvariabele
Elk punt in het spreidingsdiagram = een gecombineerde score v een respondent. Deze punten vormen
de puntenwolk die het geheel v observaties visualiseren.
RICHTING STERKTE
Positieve richting gaat samen met:
- hoge score v X hangt samen met hoge
Bij een sterk verband vinden we een duidelijk
score v Y
lineair patroon terug in de puntenwolk. Het is
- lage score v X hangt samen met lage
een smalle puntenwolk.
score v Y
- Puntenwolk stijgt naar rechts
Negatieve richting gaat samen met:
- hoge score v X hangt samen met lage
Bij een zwak verband vinden we een minder
score v Y (inverse relatie)
duidelijk lineair patroon terug en zien we een
- lage score v X hangt samen met hoge
ronde of brede puntenwolk.
score v Y
- puntenwolk daalt naar rechts
10.2) Het begrip correlatie
Covariantie = de associatiemaat voor de mate v lineaire samenhang tussen 2 variabelen v interval- of
rationiveau.
𝟏
𝒄𝒐𝒗 ( 𝑿, 𝒀) = ∑(Xi − 𝑿) ∗ (Yi − 𝒀)
𝒏
➔ Producten vd afwijkingsscores v elke waarde tov het gem. voor beide variabelen worden opgeteld
• Sxy > 0 = positieve samenhang
• Sxy < 0 = negatieve samenhang
• Sxy = 0 = lineaire onafh / geen lineaire samenhang
Nadeel: de grootte hangt af v de meeteenheid waardoor het geen maat is voor de sterkte vh verband.
Pas vanaf 100 respondenten kan je ook uitspraken doen over de sterkte vh verband.
Correlatie = de associatiemaat voor de mate v lineaire samenhang tussen 2 variabelen v interval- of
rationiveau. De correlatie is de gestandaardiseerde covariantie → de covariantie wordt herschaald
zodat er geen afh is vd meeteenheden X en Y.
25