

Keywords
Demand Quantity of products tat will be bought by customers at each different price level
Supply Quantity of products that will be supplied by producers at each different price level
Equilibrium Price The price of a product at which the quantity supplied is the same as the quantity
demanded
Inflation Price increases of products in a country
x-axis Horizontal axis of a graph
y-axis Vertical axis of a graph
How are the prices of products determined?
- No transaction occurs without a seller and a buyer agreeing on a price.
- Negotiate prices until both seller and buyer are happy with the price.
Demand for a product
- Quantity of products that customers will be prepared to buy at a certain price.
- Buyers will buy more of a certain product if the price is low and vice versa with sellers.
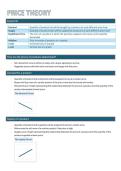
- Demand Curve: Graph representing the relationship between the price of a product and the quantity of the
product demanded at each price.
The demand Curve:
Supply of a product
- Quantity of products that suppliers will be prepared to sell at a certain price.
- Sellers want to sell more of a certain product if the price is high.
- Supply curve: Graph representing the relationship between the price of a product and the quantity of the
product supplied at each price.
The supply Curve:
Demand Quantity of products tat will be bought by customers at each different price level
Supply Quantity of products that will be supplied by producers at each different price level
Equilibrium Price The price of a product at which the quantity supplied is the same as the quantity
demanded
Inflation Price increases of products in a country
x-axis Horizontal axis of a graph
y-axis Vertical axis of a graph
How are the prices of products determined?
- No transaction occurs without a seller and a buyer agreeing on a price.
- Negotiate prices until both seller and buyer are happy with the price.
Demand for a product
- Quantity of products that customers will be prepared to buy at a certain price.
- Buyers will buy more of a certain product if the price is low and vice versa with sellers.
- Demand Curve: Graph representing the relationship between the price of a product and the quantity of the
product demanded at each price.
The demand Curve:
Supply of a product
- Quantity of products that suppliers will be prepared to sell at a certain price.
- Sellers want to sell more of a certain product if the price is high.
- Supply curve: Graph representing the relationship between the price of a product and the quantity of the
product supplied at each price.
The supply Curve:


