The Area under a Curve
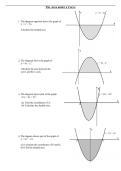
1. The diagram opposite shows the graph of
y = x2 – 5x.
Calculate the shaded area.
2. The diagram shows the graph of
y = 4x – x2.
Calculate the area between the
curve and the x-axis.
3. The diagram shows part of the graph
of y = 6x + 2x2.
(a) Find the coordinates of A.
(b) Calculate the shaded area.
4. The dagram shows part of the graph of
y = 2x2 – 18.
(a) Calculate the coordinates of P and Q.
(b) Find the shaded area.