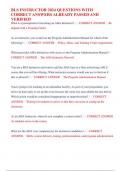
Positive and negative trends
in annual sales
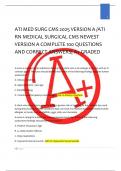
, annual_sales
date purchase_id customer_id revenue avg_purchase_value
2/19/2019 209 3808 $305000 $80
1/2/2018 215 3808 $300000 $105
5/30/2017 300 3808 $200000 $180
9/15/2016 347 3808 $189000 $250
12/11/2016 872 5170 $100500 $500
2/8/2015 976 5170 $75000 $525
1/22/2014 787 8521 $30450 $555
11/30/2013 133 9574 $25900 $515
10/18/2012 800 4263 $25500 $350
2/15/2011 645 4263 $7500 $600
6/7/2011 950 4263 $10000 $610
in annual sales
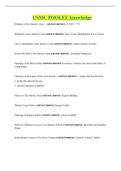
, annual_sales
date purchase_id customer_id revenue avg_purchase_value
2/19/2019 209 3808 $305000 $80
1/2/2018 215 3808 $300000 $105
5/30/2017 300 3808 $200000 $180
9/15/2016 347 3808 $189000 $250
12/11/2016 872 5170 $100500 $500
2/8/2015 976 5170 $75000 $525
1/22/2014 787 8521 $30450 $555
11/30/2013 133 9574 $25900 $515
10/18/2012 800 4263 $25500 $350
2/15/2011 645 4263 $7500 $600
6/7/2011 950 4263 $10000 $610