WGU C955 APPLIED PROBABILITY AND STATISTICS OA
1. What is 3/4 divided by 2/3?
A) 9/8
B) 5/12
C) 5/7
D) 6/7: 9/8
2. A county park has hiking paths with lengths of 1.05, 3.6, 3.17, and 2.2 miles.
What is the total length, in miles, of hiking paths in the park?
A) 9.02 miles
B) 10.02 miles
C) 10.12 miles
D) 11.2 miles: 10.02 miles
3. If there are 2 tablespoons in 1 fluid ounce, how many tablespoons does the
following calculation yield?
4 fl oz - 1.5 tbsp
0.5 tbsp
1 tbsp
2.5 tbsp
6.5 tbsp: 6.5 tbsp
4. Solve for X:
X - 5/4 = 2/3
A) 3/12
B) 7/12
C) 10/12
D) 23/12: 23/12
5. Solve for X:
X+5/3=2/3
A) -3
B) -1
C) 1
D) 3: -1
6. Given the inequality:
2y + 6 > 20
Which graph is the solution?
A) {{ y < 3 }}
, WGU C955 APPLIED PROBABILITY AND STATISTICS OA
B) {{ y > 6 }}
C) {{ y > 7 }}
D) {{ y < 7 }}: {{ y > 7 }}
7. Which graph is the solution for y < 8?
A) {{ unfilled circle on 8, arrow pointing left }}
B) {{ filled circle on 8, arrow point left }}
C) {{ unfilled circle on 8, arrow pointing right }}
D) {{ filled circle on 8, arrow point right }}: {{ unfilled circle on 8, arrow pointing
left }}
8. Which graph is the solution for 4y - 6 > 18?
A) {{ y > 4 }}
B) {{ y > 6 }}
C) {{ y < 4 }}
D) {{ y < 6 }}: {{ y > 6 }}
9. What is the correct line graph for y = 3x + 5?
A) (0,5) to (2,11)
B) (0,-5) to (2,-11)
C) (0,3) to (2,5)
D) (0,3) to (2,-7): (0,5) to (2,11)
10. What is the correct line graph for y = -2x + 9?
A) (0,9) to (4.5,0)
B) (0,9) to (3,0)
C) (0,-9) to (5,-19)
D) (0,-9) to (5,-24): (0,9) to (4.5,0)
11. A normally distributed data set has a mean of 25 and a standard deviation
of 2.
Which percentage of the data falls between 23 and 25?
A) 34.0
B) 68.0
C) 95.0
D) 99.7: 34.0
12. A given data set is normally distributed with a mean of 200 and a standard
deviation of 5.
Which two values does 95% of the data fall between?
,A) 180-220
B) 185-225
C) 190-210
D) 195-235: 190-210
13. In a statistics class, 40 students are asked to write their age on a piece
of paper and place the paper in a box. After rotating and shaking the box, 5
pieces of paper are drawn from the box at random. The data results are as
follows:
36
22
21
20
19
What is the median for this data set?
A) 17
B) 21
C) 24
D) 28: 21
14. A new video gaming site wants to know what the median age is of its
adolescent population so they can focus on activities for these clients. A
data analyst recorded the ages of 12 adolescents who used the site over a
three-month period. The results are given below:
Age ,Frequency
13 ,1
16 ,2
17 ,2
18 ,3
19 ,4
What is the median age of the adolescents?
A) 17.0
B) 17.2
C) 18.0
D) 18.6: 18.0
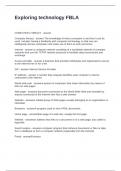
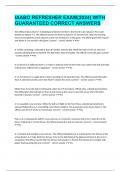
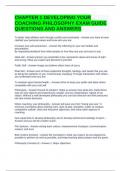
, 15. The graph shows a company's profits, in thousands of dollars, for five
different regions:
{{
Y = Profits in Thousands of Dollars
X=ABCDE
A = 29
B = 34
C = 15
D = 40
E = 22
}}
Based on this graph, what is the closest approximate total profit (in thou-
sands) for all five regions?
100
140
170
200: 140
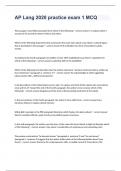
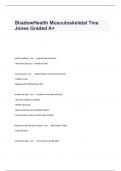
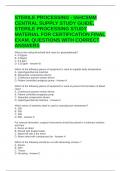
16. The bar chart below summarizes the final grade distribution for a statis-
tics course:
{{
Y = Count
X = ABC D F
A=5
B=9
C = 11
D=8
F=7
}}
Which percentage of students earned a B in the statistics course?
A) 9%
B) 22.5%
C) 27.5%
D) 40%: 22.5%
1. What is 3/4 divided by 2/3?
A) 9/8
B) 5/12
C) 5/7
D) 6/7: 9/8
2. A county park has hiking paths with lengths of 1.05, 3.6, 3.17, and 2.2 miles.
What is the total length, in miles, of hiking paths in the park?
A) 9.02 miles
B) 10.02 miles
C) 10.12 miles
D) 11.2 miles: 10.02 miles
3. If there are 2 tablespoons in 1 fluid ounce, how many tablespoons does the
following calculation yield?
4 fl oz - 1.5 tbsp
0.5 tbsp
1 tbsp
2.5 tbsp
6.5 tbsp: 6.5 tbsp
4. Solve for X:
X - 5/4 = 2/3
A) 3/12
B) 7/12
C) 10/12
D) 23/12: 23/12
5. Solve for X:
X+5/3=2/3
A) -3
B) -1
C) 1
D) 3: -1
6. Given the inequality:
2y + 6 > 20
Which graph is the solution?
A) {{ y < 3 }}
, WGU C955 APPLIED PROBABILITY AND STATISTICS OA
B) {{ y > 6 }}
C) {{ y > 7 }}
D) {{ y < 7 }}: {{ y > 7 }}
7. Which graph is the solution for y < 8?
A) {{ unfilled circle on 8, arrow pointing left }}
B) {{ filled circle on 8, arrow point left }}
C) {{ unfilled circle on 8, arrow pointing right }}
D) {{ filled circle on 8, arrow point right }}: {{ unfilled circle on 8, arrow pointing
left }}
8. Which graph is the solution for 4y - 6 > 18?
A) {{ y > 4 }}
B) {{ y > 6 }}
C) {{ y < 4 }}
D) {{ y < 6 }}: {{ y > 6 }}
9. What is the correct line graph for y = 3x + 5?
A) (0,5) to (2,11)
B) (0,-5) to (2,-11)
C) (0,3) to (2,5)
D) (0,3) to (2,-7): (0,5) to (2,11)
10. What is the correct line graph for y = -2x + 9?
A) (0,9) to (4.5,0)
B) (0,9) to (3,0)
C) (0,-9) to (5,-19)
D) (0,-9) to (5,-24): (0,9) to (4.5,0)
11. A normally distributed data set has a mean of 25 and a standard deviation
of 2.
Which percentage of the data falls between 23 and 25?
A) 34.0
B) 68.0
C) 95.0
D) 99.7: 34.0
12. A given data set is normally distributed with a mean of 200 and a standard
deviation of 5.
Which two values does 95% of the data fall between?
,A) 180-220
B) 185-225
C) 190-210
D) 195-235: 190-210
13. In a statistics class, 40 students are asked to write their age on a piece
of paper and place the paper in a box. After rotating and shaking the box, 5
pieces of paper are drawn from the box at random. The data results are as
follows:
36
22
21
20
19
What is the median for this data set?
A) 17
B) 21
C) 24
D) 28: 21
14. A new video gaming site wants to know what the median age is of its
adolescent population so they can focus on activities for these clients. A
data analyst recorded the ages of 12 adolescents who used the site over a
three-month period. The results are given below:
Age ,Frequency
13 ,1
16 ,2
17 ,2
18 ,3
19 ,4
What is the median age of the adolescents?
A) 17.0
B) 17.2
C) 18.0
D) 18.6: 18.0
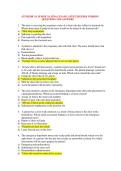
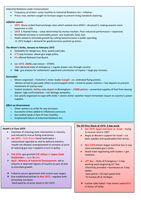
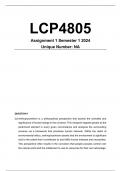
, 15. The graph shows a company's profits, in thousands of dollars, for five
different regions:
{{
Y = Profits in Thousands of Dollars
X=ABCDE
A = 29
B = 34
C = 15
D = 40
E = 22
}}
Based on this graph, what is the closest approximate total profit (in thou-
sands) for all five regions?
100
140
170
200: 140
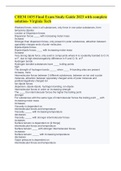
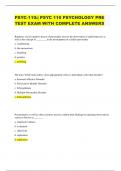
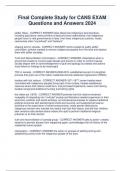
16. The bar chart below summarizes the final grade distribution for a statis-
tics course:
{{
Y = Count
X = ABC D F
A=5
B=9
C = 11
D=8
F=7
}}
Which percentage of students earned a B in the statistics course?
A) 9%
B) 22.5%
C) 27.5%
D) 40%: 22.5%