Step 3
Biostats and Epidemiology
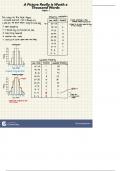
Mean = sum of all the values divided by the number of values
- 5 + 4 + 6 = = 5
- Highest in a positive skew (graph tail on the right)
Median = the value that is in the middle of all the values
- Line up the values in numerical order and alternate crossing off the lowest value and the
highest value
- 3, 5, 7, 9, 12, 14, 16 = 9 (number in the middle)
- If there is an even number of values take the average of the two remaining numbers
- 3, 5, 7, 9, 11, 14, 16, 17 = 9,11 = (9 + 11) / 2 = (20) / 2 = 10
Mode = the value that comes up the most often
- 3, 3, 5, 6, 7, 8, 8, 8, 9, 10 = 8
- Highest in a negative skew (graph tail on the left)
Types of Data
Nominal data
- Characterized by name only with no particular order
- Ex: blood types
Ordinal data
- Occurs in a particular order with no clear break points
- Ex: student rank list
Interval data
- Clear break points in the set of data points
- Ex: CD4 count used as a point to stop PCP prophylaxis
Ratio data
- Interval data that has cutoff points
Sensitivity = TP / (TP + FN) - down the left side
Specificity = TN / (TN + FP) - up the right side
Positive predictive value = TP / (TP + FP) - top row to the right
Negative predictive value = TN / (TN + FN) - bottom row to the left
False negative rate = FN / (FN + TP) - reverse of sensitivity
False positive rate = FP / (TN+ FP) - reverse of specificity
As prevalence increases, the greater the positive predictive value is
Sensitivity
- Likelihood a test will detect all people with the disease
, - A negative test will exclude that disease in a population
- A perfect test will have no false negative
- Negative test rules out disease
Specificity
- Likelihood that a person without a disease are correctly identified as disease negative
- Those with no disease will test negative
- A positive results rules disease in
Type I vs Type II Error
- Type I = false positive (Rejecting the null hypothesis when it is true)
- Type I is alpha
- Ex: Rejecting the null hypothesis when it is true, saying the drug works when it does not
- Type II = false negative (Not rejecting the null hypothesis when it is false)
- Ex: Accepting the null hypothesis, saying a drug doesn’t work when it does
- Type II is beta
- Power = 1 - beta
Factors That Decrease Errors
- Increased sample size
- Increased difference between groups (effect size)
- Increased precision of results (lowers standard deviation)
Relative Risk (RR) vs Relative Risk Reduction (RRR) vs Attributable Risk (AR) vs
Absolute Risk Reduction (ARR)
- Divide the relatives (RR) = incidence of risk among those exposed / incidence of risk
among those not exposed = (a / a + b) / (c / c + d)
- RRR = 1 - RR
- Subtract the attributes (AR) = incidence of risk among those exposed - incidence of risk
among those not exposed = (a / a + b) - (c / c + d)
- Absolutely backward attributes (ARR) = (c / c + d) - (a / a + b)
Number Needed to Treat vs Number Needed to Harm
- Treat (5 letters) vs Harm (4 letters)
- Treat is longer than Harm
- ARR is longer than AR
- NNT = 1 / ARR
- NNH = 1 / AR
Prevalence vs Incidence
- Prevalence is the total number at any given time (total cases)
- Prevalence = (A+C) / (A+B+C+D)
, - Incidence is the number during a specific time frame (cases per year)
- Incidence = Prevalence / time period
Accuracy, Precision, Reliability
Accuracy
- Validity
- Combination of sensitivity and specificity
- (A+D) / (A+B+C+D)
Precision
- Immune from randomness
- Data is clustered together at one point
- A / (A+B)
Reliability
- Reproducibility of the test
Odds Ratio vs Relative Risk
- Odds ratio used for a case-control study
- Odds ratio = (a + d) / (b + c)
- Relative risk used for cohort study
- RR = (a / a + b) / (c / c + d)
- RR < 1 = reduced risk
- RR > 1 = increased risk
- RR = 1 = no risk
Types of Studies
Case-Control Study vs Cohort Study
- Case-control = odds of previous exposure on the development of a disease. Starts with
those who have a disease and looks backwards to assess for risk exposure
- Cohort = compares those exposed to something or have a disease to those not exposed
or have the disease. Can be either prospective vs retrospective
- Cohort uses Relative Risk
Case Series = small collection of individual cases
- No control group
- Good for rare diseases or rare exposures
- Lowest level of evidence
- Ex: A group of researchers study a several cases Cruezfedlt-Jakob disease in a
rural town
Cross-Sectional Study = during a specific period of time to measure prevalence
- Measures Prevalence
- Ex: A group of researcher study the number of patient’s who developed
Clostridium difficile infections during the past year at a hospital
, Randomized Clinical Trial
- Gold standard for research for therapeutic and preventive therapies
- Highest level of evidence (especially if a meta-analysis of multiple trials is done)
Meta-analysis = compares the results from multiple different studies and comes to a single
conclusion
Negatives stay on the left, Positives stay on the right
- Falses in the overlap
Lowering the threshold = decreased FN, increased FP
- Sensitivity increases
- Specificity decreases
- PPV decreases
- NPV increases
- Ex: A states local health board has decided to lower the threshold of lead
exposure to determine lead toxicity in children. This means less lead is needed to
get a positive result causing the number of false positives to decrease and the
number of false positives to increase.
Increasing the threshold = increased FN, decreased FP
- Sensitivity decreases
- Specificity increases
- PPV increases
- NPV decreases
Sensitivity and NPV go together (Sensitive topics have No People Viewing)
Specificity and PPV go together (Watch a Specific PPV event)
Statistical Tests
- T-test = compares the MEAN of 2 sample groups (ex: comparing the weight loss among
patients who were placed on Ozempic compared to standardized diet)
- ANOVA = compares the MEAN of 3 OR MORE sample groups (ex: comparing the
weight loss among patients who were placed on Ozempic, standardized diet, and
standardized exercise program)
- Chi-square = compares CATEGORICAL data between groups to determine if groups are
related (ex: comparing vaccination status in those who contract a disease)
Z scores
- Based on the standard deviation (SD) around the mean
- Z score of one SD = 1, of two SD = 2
Biostats and Epidemiology
Mean = sum of all the values divided by the number of values
- 5 + 4 + 6 = = 5
- Highest in a positive skew (graph tail on the right)
Median = the value that is in the middle of all the values
- Line up the values in numerical order and alternate crossing off the lowest value and the
highest value
- 3, 5, 7, 9, 12, 14, 16 = 9 (number in the middle)
- If there is an even number of values take the average of the two remaining numbers
- 3, 5, 7, 9, 11, 14, 16, 17 = 9,11 = (9 + 11) / 2 = (20) / 2 = 10
Mode = the value that comes up the most often
- 3, 3, 5, 6, 7, 8, 8, 8, 9, 10 = 8
- Highest in a negative skew (graph tail on the left)
Types of Data
Nominal data
- Characterized by name only with no particular order
- Ex: blood types
Ordinal data
- Occurs in a particular order with no clear break points
- Ex: student rank list
Interval data
- Clear break points in the set of data points
- Ex: CD4 count used as a point to stop PCP prophylaxis
Ratio data
- Interval data that has cutoff points
Sensitivity = TP / (TP + FN) - down the left side
Specificity = TN / (TN + FP) - up the right side
Positive predictive value = TP / (TP + FP) - top row to the right
Negative predictive value = TN / (TN + FN) - bottom row to the left
False negative rate = FN / (FN + TP) - reverse of sensitivity
False positive rate = FP / (TN+ FP) - reverse of specificity
As prevalence increases, the greater the positive predictive value is
Sensitivity
- Likelihood a test will detect all people with the disease
, - A negative test will exclude that disease in a population
- A perfect test will have no false negative
- Negative test rules out disease
Specificity
- Likelihood that a person without a disease are correctly identified as disease negative
- Those with no disease will test negative
- A positive results rules disease in
Type I vs Type II Error
- Type I = false positive (Rejecting the null hypothesis when it is true)
- Type I is alpha
- Ex: Rejecting the null hypothesis when it is true, saying the drug works when it does not
- Type II = false negative (Not rejecting the null hypothesis when it is false)
- Ex: Accepting the null hypothesis, saying a drug doesn’t work when it does
- Type II is beta
- Power = 1 - beta
Factors That Decrease Errors
- Increased sample size
- Increased difference between groups (effect size)
- Increased precision of results (lowers standard deviation)
Relative Risk (RR) vs Relative Risk Reduction (RRR) vs Attributable Risk (AR) vs
Absolute Risk Reduction (ARR)
- Divide the relatives (RR) = incidence of risk among those exposed / incidence of risk
among those not exposed = (a / a + b) / (c / c + d)
- RRR = 1 - RR
- Subtract the attributes (AR) = incidence of risk among those exposed - incidence of risk
among those not exposed = (a / a + b) - (c / c + d)
- Absolutely backward attributes (ARR) = (c / c + d) - (a / a + b)
Number Needed to Treat vs Number Needed to Harm
- Treat (5 letters) vs Harm (4 letters)
- Treat is longer than Harm
- ARR is longer than AR
- NNT = 1 / ARR
- NNH = 1 / AR
Prevalence vs Incidence
- Prevalence is the total number at any given time (total cases)
- Prevalence = (A+C) / (A+B+C+D)
, - Incidence is the number during a specific time frame (cases per year)
- Incidence = Prevalence / time period
Accuracy, Precision, Reliability
Accuracy
- Validity
- Combination of sensitivity and specificity
- (A+D) / (A+B+C+D)
Precision
- Immune from randomness
- Data is clustered together at one point
- A / (A+B)
Reliability
- Reproducibility of the test
Odds Ratio vs Relative Risk
- Odds ratio used for a case-control study
- Odds ratio = (a + d) / (b + c)
- Relative risk used for cohort study
- RR = (a / a + b) / (c / c + d)
- RR < 1 = reduced risk
- RR > 1 = increased risk
- RR = 1 = no risk
Types of Studies
Case-Control Study vs Cohort Study
- Case-control = odds of previous exposure on the development of a disease. Starts with
those who have a disease and looks backwards to assess for risk exposure
- Cohort = compares those exposed to something or have a disease to those not exposed
or have the disease. Can be either prospective vs retrospective
- Cohort uses Relative Risk
Case Series = small collection of individual cases
- No control group
- Good for rare diseases or rare exposures
- Lowest level of evidence
- Ex: A group of researchers study a several cases Cruezfedlt-Jakob disease in a
rural town
Cross-Sectional Study = during a specific period of time to measure prevalence
- Measures Prevalence
- Ex: A group of researcher study the number of patient’s who developed
Clostridium difficile infections during the past year at a hospital
, Randomized Clinical Trial
- Gold standard for research for therapeutic and preventive therapies
- Highest level of evidence (especially if a meta-analysis of multiple trials is done)
Meta-analysis = compares the results from multiple different studies and comes to a single
conclusion
Negatives stay on the left, Positives stay on the right
- Falses in the overlap
Lowering the threshold = decreased FN, increased FP
- Sensitivity increases
- Specificity decreases
- PPV decreases
- NPV increases
- Ex: A states local health board has decided to lower the threshold of lead
exposure to determine lead toxicity in children. This means less lead is needed to
get a positive result causing the number of false positives to decrease and the
number of false positives to increase.
Increasing the threshold = increased FN, decreased FP
- Sensitivity decreases
- Specificity increases
- PPV increases
- NPV decreases
Sensitivity and NPV go together (Sensitive topics have No People Viewing)
Specificity and PPV go together (Watch a Specific PPV event)
Statistical Tests
- T-test = compares the MEAN of 2 sample groups (ex: comparing the weight loss among
patients who were placed on Ozempic compared to standardized diet)
- ANOVA = compares the MEAN of 3 OR MORE sample groups (ex: comparing the
weight loss among patients who were placed on Ozempic, standardized diet, and
standardized exercise program)
- Chi-square = compares CATEGORICAL data between groups to determine if groups are
related (ex: comparing vaccination status in those who contract a disease)
Z scores
- Based on the standard deviation (SD) around the mean
- Z score of one SD = 1, of two SD = 2