Layla Dempsey
D459 Task 3
WGU's Four-Step Tool (based on "Six Steps to Thinking Systemically" by Michael Goodman and
Richard Karash)
The Iceberg Tool is a way to see how the underlying structure causes the individual events and the patterns or
trends that emerge from recurring events. Using the Iceberg Tool allows you to see the basic facts and
interconnections, an important first step.
STEP 1: Complete an Iceberg Tool for this case study.
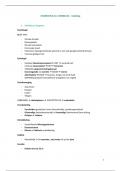
Iceberg Tool to Understand Patterns and Structure
Questions to Ask
1. What are the key events in this case study?
• Ms. Jackson stocked a craft cart with a lot of different art materials despite a
limited budget. The students used the new materials responsibly at first, but
eventually they started using more to try and impress their teacher. This
caused the materials to be used up quickly. As the year went on, what used to
be fun, art time turned into arguments over the little supplies left. This caused
everyone’s excitement for art class to decline.
2. What patterns do you notice in the key events of this case study?
• The patterns show that as the supplies decreased, students' frustration
and conflicts increased.
, Layla Dempsey
D459 Task 3
3. What structure(s) explain the patterns of events in this case study?
• This structure started a loop of restocking and overuse. This shows a system
that overuse and low budgets led to a shortage of supplies and a lackluster
experience for the class.
The BOT Graph helps you identify how behaviors play out over time; here, the time is the period in which the case study
occurred. It is best to group similar events or patterns together in a graph; for example, you might create one BOT Graph
showing the actions of different team members (all actions) and another for the investments made in marketing
campaigns and the resulting return on those investments (all money).
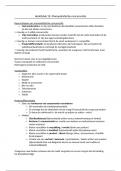
STEP 2: Complete at least one Behavior Over Time (BOT) Graph by drawing and clearly labeling
one or more lines representing key patterns in your selected case study. (You can use the
Drawing Tools in Word to create the lines on the template provided below.)
Behavior
Art Supplies
Remember to label or describe the behavior(s) depicted in your BOT Graph(s) above.
STEP 3: Select the systems archetype that best fits the case study. You may wish to refer to A
Pocket Guide for Using the Archetypes.
The value of the eight systems archetypes is that they represent common systemic problems. If you can find an archetype
that fits the system and the problem(s) you are confronting, you can use established ideas to deal with the problem(s).
Examine each archetype carefully, comparing its causal loop diagram and text description with the given case study to
see which one is the best fit.
1. Which archetype did you select?
D459 Task 3
WGU's Four-Step Tool (based on "Six Steps to Thinking Systemically" by Michael Goodman and
Richard Karash)
The Iceberg Tool is a way to see how the underlying structure causes the individual events and the patterns or
trends that emerge from recurring events. Using the Iceberg Tool allows you to see the basic facts and
interconnections, an important first step.
STEP 1: Complete an Iceberg Tool for this case study.
Iceberg Tool to Understand Patterns and Structure
Questions to Ask
1. What are the key events in this case study?
• Ms. Jackson stocked a craft cart with a lot of different art materials despite a
limited budget. The students used the new materials responsibly at first, but
eventually they started using more to try and impress their teacher. This
caused the materials to be used up quickly. As the year went on, what used to
be fun, art time turned into arguments over the little supplies left. This caused
everyone’s excitement for art class to decline.
2. What patterns do you notice in the key events of this case study?
• The patterns show that as the supplies decreased, students' frustration
and conflicts increased.
, Layla Dempsey
D459 Task 3
3. What structure(s) explain the patterns of events in this case study?
• This structure started a loop of restocking and overuse. This shows a system
that overuse and low budgets led to a shortage of supplies and a lackluster
experience for the class.
The BOT Graph helps you identify how behaviors play out over time; here, the time is the period in which the case study
occurred. It is best to group similar events or patterns together in a graph; for example, you might create one BOT Graph
showing the actions of different team members (all actions) and another for the investments made in marketing
campaigns and the resulting return on those investments (all money).
STEP 2: Complete at least one Behavior Over Time (BOT) Graph by drawing and clearly labeling
one or more lines representing key patterns in your selected case study. (You can use the
Drawing Tools in Word to create the lines on the template provided below.)
Behavior
Art Supplies
Remember to label or describe the behavior(s) depicted in your BOT Graph(s) above.
STEP 3: Select the systems archetype that best fits the case study. You may wish to refer to A
Pocket Guide for Using the Archetypes.
The value of the eight systems archetypes is that they represent common systemic problems. If you can find an archetype
that fits the system and the problem(s) you are confronting, you can use established ideas to deal with the problem(s).
Examine each archetype carefully, comparing its causal loop diagram and text description with the given case study to
see which one is the best fit.
1. Which archetype did you select?