FINAL - SUMMARY (DOES NOT INCLUDE MIDTERM CONTENT)
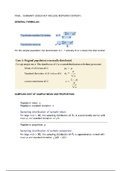
GENERAL FORMULAS:
For the sample population, the denominator is n - 1 whereby N or n means the total number
SAMPLING DIST OF SAMPLE MEAN AND PROPORTION:
,ESTIMATING POPULATION PROPORTION:
- The sample proportion p is the best point estimate of the population proportion p.
- CONFIDENCE INTERVAL: The confidence level is the probability 1 - a (such as 0.95, or
95%) that the confidence interval actually does contain the population parameter,
assuming that the estimation process is repeated a large number of times. (The confi-
dence level is also called the degree of confidence, or the confidence coefficient.)
- CRITICAL VALUE: A critical value is the number on the borderline separating sample
statistics that are likely to occur from those that are unlikely. The number za>2 is a
critical value that is a z score with the property that it separates an area of a/2 in the right
tail of the standard normal distribution (as in Figure 2).
-
Find Confidence Intervals proportions:
CONFIDENCE INTERVAL FOR ESTIMATONG PROP
Finding the Sample Size Required to Estimate a Population Proportion:
,Round to the whole number for n
Finding the Point Estimate and E from a Confidence Interval
, ESTIMATING POPULATION MEAN:
Find Confidence Intervals Meam:
CONFIDENCE INTERVAL FOR ESTIMATING MEAN STDV NOT KNOWN
Important Properties of the Student t Distribution:
Because s is rarely known, confidence interval estimates of a population mean m almost always
use the Student t distribution instead of the standard normal distribu- tion. Here are some
important properties of the Student t distribution.
1. The Student t distribution is different for different sample sizes. (See Figure 5
for the cases n = 3 and n = 12.)
2. The Student t distribution has the same general symmetric bell shape as the standard normal
distribution, but has more variability (with wider distribu- tions) as we expect with small samples.
GENERAL FORMULAS:
For the sample population, the denominator is n - 1 whereby N or n means the total number
SAMPLING DIST OF SAMPLE MEAN AND PROPORTION:
,ESTIMATING POPULATION PROPORTION:
- The sample proportion p is the best point estimate of the population proportion p.
- CONFIDENCE INTERVAL: The confidence level is the probability 1 - a (such as 0.95, or
95%) that the confidence interval actually does contain the population parameter,
assuming that the estimation process is repeated a large number of times. (The confi-
dence level is also called the degree of confidence, or the confidence coefficient.)
- CRITICAL VALUE: A critical value is the number on the borderline separating sample
statistics that are likely to occur from those that are unlikely. The number za>2 is a
critical value that is a z score with the property that it separates an area of a/2 in the right
tail of the standard normal distribution (as in Figure 2).
-
Find Confidence Intervals proportions:
CONFIDENCE INTERVAL FOR ESTIMATONG PROP
Finding the Sample Size Required to Estimate a Population Proportion:
,Round to the whole number for n
Finding the Point Estimate and E from a Confidence Interval
, ESTIMATING POPULATION MEAN:
Find Confidence Intervals Meam:
CONFIDENCE INTERVAL FOR ESTIMATING MEAN STDV NOT KNOWN
Important Properties of the Student t Distribution:
Because s is rarely known, confidence interval estimates of a population mean m almost always
use the Student t distribution instead of the standard normal distribu- tion. Here are some
important properties of the Student t distribution.
1. The Student t distribution is different for different sample sizes. (See Figure 5
for the cases n = 3 and n = 12.)
2. The Student t distribution has the same general symmetric bell shape as the standard normal
distribution, but has more variability (with wider distribu- tions) as we expect with small samples.