1. Question:If the median of a data set is 13 and the mean is 13, which of the following is most likely?
2. Question:Which of the following box-and-whisker plots shows a skewed data set? Select all answers that apply.
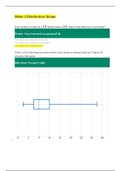
• A horizontal box-and-whisker plot is above a horizontal axis labeled from 0 to 16 in increments of 2. The box-and-whisker plot has the following five-number summary: 1, 3, 4, 6, and 15. All values are approximate. The part of the box at point 4 is represented with a dotted line.
• A horizontal box-and-whisker plot is above a horizontal axis labeled from 0 to 20 in increments of 5. The box-and-whisker plot has the following five-number summary: 4, 14, 16, 19, and 20. All values are approximate. The part of the box at point 16 is represented with a dotted line.
3. Question:Which of the following box-and-whisker plots shows a skewed data set? Select all answers that apply.
• A horizontal box-and-whisker plot is above a horizontal axis labeled from 0 to 20 in increments of 5. The box-and-whisker plot has the following five-number summary: 4, 14, 16, 19, and 20. All values are approximate. The part of the box at point 16 is represented with a dotted line.
4. Question:Which of the following histograms shows a skewed data set?
• A histogram has a horizontal axis labeled Values from negative 2 to 10 in increments of 2 and a vertical axis labeled Frequency from 0 to 300 in increments of 50. The histogram has vertical bars of width 1, starting at the horizontal axis value of negative 0.5. The approximate heights of the bars are as follows, where the horizontal axis label is listed first and the approximate height is listed second: negative 0.5, 40; 0.5, 140; 1.5, 225; 2.5, 270; 3.5, 175; 4.5, 95; 5.5, 35; 6.5, 20.
5. Question:Which of the following frequency tables show a skewed data set? Select all answers that apply.
6. Question: If the median of a data set is 13 and the mean is 23, which of the following is most likely?
7. Question: Which of the following frequency tables shows a skewed data set? Select all answers that apply.
8. Question:Which of the following lists of data has the smallest standard deviation?
9. Question:Which of the data sets represented by the following histograms has the smallest standard deviation?
10. Question:The following dataset represents the salaries for all six employees at a small start-up company.Find the mean, variance, and standard deviation for this dataset of salaries (expressed in thousands of dollars):55, 59, 63, 67, 71, 75
11. Question:A company is interested to know the variation in yearly sales amount for all 5 salespeople in the company.The dataset shown below is the sales amount sold by the 5 salespeople in the company (expressed in thousands of dollars):40,60,65,70,80
• Find the variance for this dataset.
• Find the sample variance of the following set of data:
10, 3, 10, 3, 9.
12. Question:The International Shark Attack File recorded the number of shark attacks between 1837 and 2016. Below are the total number of shark attacks for 8 U.S. states. Find the sample variance.
13. Question:For the following data set, you are interested to determine the "spread" of the data.Would you employ calculations for the sample standard deviation, or population standard deviation for this data set:
• Final Exam scores for a group of 10 students in a Statistics course with an enrollment of 30 students.
14. Question:Find the sample variance of the following set of data:11, 4, 4, 6, 10…… Round the final answer to one decimal place.
Content preview
Week 3 Distribution Shape
If the median of a data set is 13 and the mean is 13, which of the following is most likely?
Perfect. Your hard work is paying off 😀
The data are skewed to the left.
The data are skewed to the right.
The data are symmetrical.
Which of the following box-and-whisker plots shows a skewed data set? Select all
answers that apply.
Well done! You got it right.