,TESTBANK FOR Applied Marketing Analytics Using
Python First Edition by Gokhan Yildirim
Notes
1- The file is chapter after chapter.
2- We have shown you few pages sample.
3- The file contains all Appendix and Excel sheet
if it exists.
4- We have all what you need, we make update
at every time. There are many new editions
waiting you.
5- If you think you purchased the wrong file You
can contact us at every time, we can replace it
with true one.
Our email:
, Yildirim & Kübler, Applied Marketing Analytics Using Python
SAGE Publishing, 2025
Testbank
Chapter 1: Introduction
Multiple choice questions
1. Which of the following best defines marketing analytics?
a. Marketing analytics is the process of analysing datasets in a systematic way to improve
sales outcomes with the help of machine learning models.
b. Marketing analytics is the process of collecting and analysing datasets in a systematic way
to improve sales outcomes with the help of analytic tools and techniques.
c. Marketing analytics is the process of analysing datasets in a systematic way to draw
conclusions on customer acquisition and retention strategies with the help of analytic
tools and techniques.
d. Marketing analytics is the process of collecting and analysing datasets in a systematic way
to draw conclusions on marketing strategies and improve business outcomes with the
help of analytic tools and techniques.
e. Marketing analytics is the process of collecting and analysing datasets in a systematic way
to improve business outcomes with the help of text mining and image analytics tools.
Ans: D
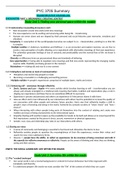
2. The diagram below illustrates the typical five-stage process that marketing analytics
applications go through, but it lacks the names of these stages.
Which of the following captures the process best?
, Yildirim & Kübler, Applied Marketing Analytics Using Python
SAGE Publishing, 2025
a. 1: Analytic models, 2: Insights, 3: Action, 4: Cloud storage, 5: Data
b. 1: Data, 2: Analytic models, 3: Cloud storage, 4: Action, 5: Insight
c. 1: Cloud storage, 2: Analytic models, 3: Data, 4: Insights, 5: Action
d. 1: Insights, 2: Cloud storage 3: Action, 4: Data, 5: Analytic models
e. 1: Data, 2: Cloud storage, 3: Analytic models, 4: Insights, 5: Action
Ans: E
3. Incorporating the results of quantitative models into intuition-led decision-making is
referred to as:
a. Face validity
b. Quantification
c. Quantitative intuition
d. Content validity
e. Predictive analytics
Ans: C
4. You have observed that the model-based recommendations align with your knowledge on
the topic and intuition-led recommendations regarding the direction of change for your
marketing decisions. In marketing analytics, this phenomenon is known as:
a. Data mining
b. Face validity
c. Quantification
d. Logical thinking
e. Market trend analysis
Ans: B
5. The model precisely indicates the extent to which each marketing action should be
increased or decreased. This is known as:
a. Quantification
, Yildirim & Kübler, Applied Marketing Analytics Using Python
SAGE Publishing, 2025
b. Data integration
c. Intuition-led decision-making
d. Market research
e. Data accuracy
Ans: A
6. Which of the following is less of a challenge in implementing the marketing analytics
projects in an organization?
a. Disconnect between departments
b. Not knowing which one to prioritize – speed or quality
c. The absence of ‘data culture’
d. Real-time reporting
e. Not having the relevant data for the problem at hand
Ans: D
7. Which of the following does not represent a pitfall for marketing analytics?
a. The use of inappropriate tools and methods
b. Data quality
c. Data processing and data matching
d. Confirmation bias
e. Well-defined data collection strategy
Ans: E
Open-ended questions
8. You have been hired as a marketing analyst by a fashion retailer and tasked with
delivering a presentation to your colleagues in the marketing department on how the
business can benefit from marketing analytics. Explain and give examples of marketing
analytics applications that the business can utilize to enhance its business outcomes.
Ans: Students are expected to discuss the applications of consumer profiling, text mining,
real-time targeting, media planning, measuring return on marketing investment and
, Yildirim & Kübler, Applied Marketing Analytics Using Python
SAGE Publishing, 2025
predicting future demand. Some students with a background in analytics or data science
could give examples of customer analytics tools such as recency-frequency-monetary and
customer lifetime value.
9. A chief marketing officer of a car rental company states, ‘We have allocated a significant
portion of our marketing budget to analytics in recent years. However, I must say that
some of our analytics projects remain incomplete and some have failed to meet our
expectations. We have not observed a significant improvement in how analytics
contribute to our company’s performance really’. What are the common reasons behind
the failure of marketing analytics applications? Please discuss your answer briefly.
Ans: Students should discuss the following points in their answers:
Marketing analytics fails if:
• you do not define the business problem clearly
• the model and data do not map to the business problem
• data collected by different systems is disjointed
• you neglect unobserved factors
• you do not apply the model correctly
• you focus on performance metrics that do not matter
• you do not have the right talent to leverage marketing analytics
10. You are being interviewed for the position of marketing analytics director at a fintech
company that has not previously had a marketing analytics team. The role entails building
a successful analytics team. Which factors or key players would you consider when
forming such a team?
Ans: The marketing analytics director (MAD) is a leadership role that requires strong
domain knowledge as well as strategic decision-making skills. Building a successful
analytics team requires careful consideration on the following factors:
, Yildirim & Kübler, Applied Marketing Analytics Using Python
SAGE Publishing, 2025
1. Mindset. The team members must have the right mindset and embrace the fact that
analytics and AI-supported tools can resolve marketing issues and/or unearth new
opportunities for growth.
The MAD should consider the following essential roles for her team:
Data analyst. People working in this role are typically in charge of (i) collecting,
integrating and maintaining large-scale datasets and (ii) developing algorithms,
executing analytical models and preparing data visualizations. This role is quite
technical and requires advanced data, software and programming skills.
Data translator. This role plays a bridging role between data analysts and data directors.
Data translators help analysts (i) look at the right marketing problems and how to
approach them, (ii) define the scope of a project and outline the deliverables and (iii)
interpret the results and determine the next best course of action. Also, they generate
project reports and communicate the results to marketing analytics directors. These
people should have training in marketing analytics and possess some strong team and
communication skills.
How big the team should be, of course, depends on the size of the organization, the long-
term needs and other financial constraints. To be able to get analytics projects up and
running, the team should have access to data analytics software such as R, Python, MATLAB
or SAS along with high-powered computers.
END of TEST
, Yildirim & Kübler, Applied Marketing Analytics Using Python
SAGE Publishing, 2025
Testbank
Chapter 2: Customer segmentation
Multiple choice questions for in-class exam
Cluster numbers
1. What is the main purpose of the elbow plot in clustering analysis?
a. To determine the optimal number of clusters
b. To visualise the within-cluster variance
c. To assess the similarity between clusters
d. To evaluate the performance of different clustering algorithms
Ans: A
2. How is the elbow point determined in an elbow plot?
a. It is the point where the within-cluster variance reaches zero
b. It is the point where the within-cluster variance starts to level off
c. It is the point where the number of clusters is at its maximum
d. It is the point where the between-cluster variance is maximised
Ans: B
3. What does a steep drop in within-cluster variance after the elbow point indicate?
a. The optimal number of clusters has been reached
b. The clusters are well-separated and distinct
c. The clustering algorithm needs to be recalibrated
d. The data may not be suitable for clustering analysis
Ans: B
, Yildirim & Kübler, Applied Marketing Analytics Using Python
SAGE Publishing, 2025
4. In an elbow plot, what does it mean if there is no clear elbow point?
a. The clustering algorithm is not working properly
b. The data do not exhibit any meaningful patterns
c. There is no distinct optimal number of clusters
d. The within-cluster variance is too high to determine an elbow point
Ans: C
k-means
1. What is the primary goal of k-means clustering?
a. To minimise within-cluster variance
b. To maximise between-cluster variance
c. To find the optimal number of clusters
d. To assign data points to predefined clusters
Ans: D
2. How does the k-means algorithm initialise the cluster centroids?
a. Randomly select data points as initial centroids
b. Place centroids at equal distances from each other
c. Assign each data point to the nearest centroid
d. Use the mean values of each feature as initial centroids
Ans: C
3. What happens in each iteration of the k-means algorithm?
a. The cluster centroids remain fixed, and data points are reassigned to the nearest centroid
b. The cluster centroids are recalculated based on the current assignments
c. The number of clusters is adjusted based on the within-cluster variance
d. The algorithm terminates if the within-cluster variance reaches zero
Ans: B
, Yildirim & Kübler, Applied Marketing Analytics Using Python
SAGE Publishing, 2025
4. How is the optimal number of clusters determined in k-means clustering?
a. By visually inspecting the scatterplot of the data
b. By using the elbow method and evaluating the within-cluster variance
c. By performing a hierarchical clustering analysis
d. By setting the number of clusters based on domain knowledge
Ans: B
5. What is a limitation of k-means clustering?
a. It is sensitive to the initial placement of cluster centroids
b. It cannot handle high-dimensional data
c. It only works with numeric data
d. It is computationally inefficient for large datasets
Ans: A
Segmentation, targeting and positioning (STP) analysis
1. What is the primary purpose of segmentation in the STP analysis?
a. To identify the target market for a product or service
b. To position the product in the market
c. To create a unique value proposition
d. To differentiate the product from competitors
Ans: A
2. What is the key outcome of the targeting phase in the STP analysis?
a. Developing a positioning strategy
b. Conducting market research to understand customer preferences
c. Identifying specific segments to focus marketing efforts on
d. Analysing the competition and market trends
Ans: C
Python First Edition by Gokhan Yildirim
Notes
1- The file is chapter after chapter.
2- We have shown you few pages sample.
3- The file contains all Appendix and Excel sheet
if it exists.
4- We have all what you need, we make update
at every time. There are many new editions
waiting you.
5- If you think you purchased the wrong file You
can contact us at every time, we can replace it
with true one.
Our email:
, Yildirim & Kübler, Applied Marketing Analytics Using Python
SAGE Publishing, 2025
Testbank
Chapter 1: Introduction
Multiple choice questions
1. Which of the following best defines marketing analytics?
a. Marketing analytics is the process of analysing datasets in a systematic way to improve
sales outcomes with the help of machine learning models.
b. Marketing analytics is the process of collecting and analysing datasets in a systematic way
to improve sales outcomes with the help of analytic tools and techniques.
c. Marketing analytics is the process of analysing datasets in a systematic way to draw
conclusions on customer acquisition and retention strategies with the help of analytic
tools and techniques.
d. Marketing analytics is the process of collecting and analysing datasets in a systematic way
to draw conclusions on marketing strategies and improve business outcomes with the
help of analytic tools and techniques.
e. Marketing analytics is the process of collecting and analysing datasets in a systematic way
to improve business outcomes with the help of text mining and image analytics tools.
Ans: D
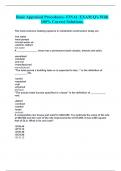
2. The diagram below illustrates the typical five-stage process that marketing analytics
applications go through, but it lacks the names of these stages.
Which of the following captures the process best?
, Yildirim & Kübler, Applied Marketing Analytics Using Python
SAGE Publishing, 2025
a. 1: Analytic models, 2: Insights, 3: Action, 4: Cloud storage, 5: Data
b. 1: Data, 2: Analytic models, 3: Cloud storage, 4: Action, 5: Insight
c. 1: Cloud storage, 2: Analytic models, 3: Data, 4: Insights, 5: Action
d. 1: Insights, 2: Cloud storage 3: Action, 4: Data, 5: Analytic models
e. 1: Data, 2: Cloud storage, 3: Analytic models, 4: Insights, 5: Action
Ans: E
3. Incorporating the results of quantitative models into intuition-led decision-making is
referred to as:
a. Face validity
b. Quantification
c. Quantitative intuition
d. Content validity
e. Predictive analytics
Ans: C
4. You have observed that the model-based recommendations align with your knowledge on
the topic and intuition-led recommendations regarding the direction of change for your
marketing decisions. In marketing analytics, this phenomenon is known as:
a. Data mining
b. Face validity
c. Quantification
d. Logical thinking
e. Market trend analysis
Ans: B
5. The model precisely indicates the extent to which each marketing action should be
increased or decreased. This is known as:
a. Quantification
, Yildirim & Kübler, Applied Marketing Analytics Using Python
SAGE Publishing, 2025
b. Data integration
c. Intuition-led decision-making
d. Market research
e. Data accuracy
Ans: A
6. Which of the following is less of a challenge in implementing the marketing analytics
projects in an organization?
a. Disconnect between departments
b. Not knowing which one to prioritize – speed or quality
c. The absence of ‘data culture’
d. Real-time reporting
e. Not having the relevant data for the problem at hand
Ans: D
7. Which of the following does not represent a pitfall for marketing analytics?
a. The use of inappropriate tools and methods
b. Data quality
c. Data processing and data matching
d. Confirmation bias
e. Well-defined data collection strategy
Ans: E
Open-ended questions
8. You have been hired as a marketing analyst by a fashion retailer and tasked with
delivering a presentation to your colleagues in the marketing department on how the
business can benefit from marketing analytics. Explain and give examples of marketing
analytics applications that the business can utilize to enhance its business outcomes.
Ans: Students are expected to discuss the applications of consumer profiling, text mining,
real-time targeting, media planning, measuring return on marketing investment and
, Yildirim & Kübler, Applied Marketing Analytics Using Python
SAGE Publishing, 2025
predicting future demand. Some students with a background in analytics or data science
could give examples of customer analytics tools such as recency-frequency-monetary and
customer lifetime value.
9. A chief marketing officer of a car rental company states, ‘We have allocated a significant
portion of our marketing budget to analytics in recent years. However, I must say that
some of our analytics projects remain incomplete and some have failed to meet our
expectations. We have not observed a significant improvement in how analytics
contribute to our company’s performance really’. What are the common reasons behind
the failure of marketing analytics applications? Please discuss your answer briefly.
Ans: Students should discuss the following points in their answers:
Marketing analytics fails if:
• you do not define the business problem clearly
• the model and data do not map to the business problem
• data collected by different systems is disjointed
• you neglect unobserved factors
• you do not apply the model correctly
• you focus on performance metrics that do not matter
• you do not have the right talent to leverage marketing analytics
10. You are being interviewed for the position of marketing analytics director at a fintech
company that has not previously had a marketing analytics team. The role entails building
a successful analytics team. Which factors or key players would you consider when
forming such a team?
Ans: The marketing analytics director (MAD) is a leadership role that requires strong
domain knowledge as well as strategic decision-making skills. Building a successful
analytics team requires careful consideration on the following factors:
, Yildirim & Kübler, Applied Marketing Analytics Using Python
SAGE Publishing, 2025
1. Mindset. The team members must have the right mindset and embrace the fact that
analytics and AI-supported tools can resolve marketing issues and/or unearth new
opportunities for growth.
The MAD should consider the following essential roles for her team:
Data analyst. People working in this role are typically in charge of (i) collecting,
integrating and maintaining large-scale datasets and (ii) developing algorithms,
executing analytical models and preparing data visualizations. This role is quite
technical and requires advanced data, software and programming skills.
Data translator. This role plays a bridging role between data analysts and data directors.
Data translators help analysts (i) look at the right marketing problems and how to
approach them, (ii) define the scope of a project and outline the deliverables and (iii)
interpret the results and determine the next best course of action. Also, they generate
project reports and communicate the results to marketing analytics directors. These
people should have training in marketing analytics and possess some strong team and
communication skills.
How big the team should be, of course, depends on the size of the organization, the long-
term needs and other financial constraints. To be able to get analytics projects up and
running, the team should have access to data analytics software such as R, Python, MATLAB
or SAS along with high-powered computers.
END of TEST
, Yildirim & Kübler, Applied Marketing Analytics Using Python
SAGE Publishing, 2025
Testbank
Chapter 2: Customer segmentation
Multiple choice questions for in-class exam
Cluster numbers
1. What is the main purpose of the elbow plot in clustering analysis?
a. To determine the optimal number of clusters
b. To visualise the within-cluster variance
c. To assess the similarity between clusters
d. To evaluate the performance of different clustering algorithms
Ans: A
2. How is the elbow point determined in an elbow plot?
a. It is the point where the within-cluster variance reaches zero
b. It is the point where the within-cluster variance starts to level off
c. It is the point where the number of clusters is at its maximum
d. It is the point where the between-cluster variance is maximised
Ans: B
3. What does a steep drop in within-cluster variance after the elbow point indicate?
a. The optimal number of clusters has been reached
b. The clusters are well-separated and distinct
c. The clustering algorithm needs to be recalibrated
d. The data may not be suitable for clustering analysis
Ans: B
, Yildirim & Kübler, Applied Marketing Analytics Using Python
SAGE Publishing, 2025
4. In an elbow plot, what does it mean if there is no clear elbow point?
a. The clustering algorithm is not working properly
b. The data do not exhibit any meaningful patterns
c. There is no distinct optimal number of clusters
d. The within-cluster variance is too high to determine an elbow point
Ans: C
k-means
1. What is the primary goal of k-means clustering?
a. To minimise within-cluster variance
b. To maximise between-cluster variance
c. To find the optimal number of clusters
d. To assign data points to predefined clusters
Ans: D
2. How does the k-means algorithm initialise the cluster centroids?
a. Randomly select data points as initial centroids
b. Place centroids at equal distances from each other
c. Assign each data point to the nearest centroid
d. Use the mean values of each feature as initial centroids
Ans: C
3. What happens in each iteration of the k-means algorithm?
a. The cluster centroids remain fixed, and data points are reassigned to the nearest centroid
b. The cluster centroids are recalculated based on the current assignments
c. The number of clusters is adjusted based on the within-cluster variance
d. The algorithm terminates if the within-cluster variance reaches zero
Ans: B
, Yildirim & Kübler, Applied Marketing Analytics Using Python
SAGE Publishing, 2025
4. How is the optimal number of clusters determined in k-means clustering?
a. By visually inspecting the scatterplot of the data
b. By using the elbow method and evaluating the within-cluster variance
c. By performing a hierarchical clustering analysis
d. By setting the number of clusters based on domain knowledge
Ans: B
5. What is a limitation of k-means clustering?
a. It is sensitive to the initial placement of cluster centroids
b. It cannot handle high-dimensional data
c. It only works with numeric data
d. It is computationally inefficient for large datasets
Ans: A
Segmentation, targeting and positioning (STP) analysis
1. What is the primary purpose of segmentation in the STP analysis?
a. To identify the target market for a product or service
b. To position the product in the market
c. To create a unique value proposition
d. To differentiate the product from competitors
Ans: A
2. What is the key outcome of the targeting phase in the STP analysis?
a. Developing a positioning strategy
b. Conducting market research to understand customer preferences
c. Identifying specific segments to focus marketing efforts on
d. Analysing the competition and market trends
Ans: C