45
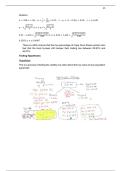
Solution:
𝑛 = 240; 𝑥 = 84; 𝑝 = = = 0.35; 1 − 𝑝 = (1 − 0.35) = 0.65; 𝑧 = ±1.645
𝑝 1−𝑝 𝑝 1−𝑝
𝑝−𝑧 𝑛
≤ 𝜋 ≤ 𝑝 + 𝑧 𝑛
0.35 1−0.35 0.35 1−0.35
0.35 − 1.645 × 240
≤ 𝜋 ≤ 0.35 + 1.645 × 240
0.2993 ≤ 𝜋 ≤ 0.4007
There is a 90% chance that the true percentage of Cape Town Street vendors who
feel that the local by-laws still hamper their trading lies between 29.93% and
40.07%
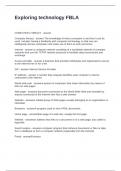
Testing Hypotheses
Hypothesis
This is a process of testing the validity of a claim about the true value of any population
parameter
, 46
Null Hypothesis 𝐻
This is a statement or claim made about the population at the start of a test and is
indicated by the symbol 𝐻 : followed by a colon.
For Example: , the null hypothesis that the population mean is 12 would be written
as 𝐻 : 𝜇 = 12
Alternative Hypothesis 𝐻
This is the hypothesis that will be adopted if the test rejects the null hypothesis 𝐻 .
It is written as 𝐻 :
For Example: , if our 𝐻 : 𝜇 = 12 then our 𝐻 : 𝜇 ≠ 12
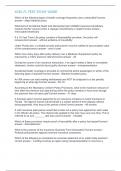
The Process of Hypothesis Testing
1. Formulate the hypothesis that is, state 𝐻 and 𝐻
2. Specify the significant level whether it is 1% or 5% or 10%
3. Set up the acceptance range based on the specified significance level
4. Calculate the sample test statistic
5. Decide whether to reject the null hypothesis
6. State the conclusion
Type Ι Error
This is the probability of rejecting the null hypothesis when in fact it is true
Type ΙΙ Error
This is the probability of accepting the null hypothesis when in fact it is false
, 47
Level of Significance
The maximum probability which we are willing to risk to wrongly reject 𝐻 . The level of
significance 𝛼 is used to find the cut-off points which separate the area of acceptance
from the area of rejection.
Critical Values
The critical value 𝑧 is the number of standard deviations which will indicate whether
to reject 𝐻 𝑎𝑛𝑑 𝑎𝑐𝑐𝑒𝑝𝑡 𝐻 .
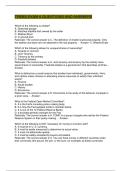
Two Tailed Test
𝐻 :𝜇 = 𝜇
𝐻 :𝜇 ≠ 𝜇
The alternative hypothesis is two sided, both large and small values of z lead us to
reject the null hypothesis.
The rejection region comprises all values of z in the left and right-hand tails of the
standard normal distribution which have a total area of 𝛼 as shown below
Solution:
𝑛 = 240; 𝑥 = 84; 𝑝 = = = 0.35; 1 − 𝑝 = (1 − 0.35) = 0.65; 𝑧 = ±1.645
𝑝 1−𝑝 𝑝 1−𝑝
𝑝−𝑧 𝑛
≤ 𝜋 ≤ 𝑝 + 𝑧 𝑛
0.35 1−0.35 0.35 1−0.35
0.35 − 1.645 × 240
≤ 𝜋 ≤ 0.35 + 1.645 × 240
0.2993 ≤ 𝜋 ≤ 0.4007
There is a 90% chance that the true percentage of Cape Town Street vendors who
feel that the local by-laws still hamper their trading lies between 29.93% and
40.07%
Testing Hypotheses
Hypothesis
This is a process of testing the validity of a claim about the true value of any population
parameter
, 46
Null Hypothesis 𝐻
This is a statement or claim made about the population at the start of a test and is
indicated by the symbol 𝐻 : followed by a colon.
For Example: , the null hypothesis that the population mean is 12 would be written
as 𝐻 : 𝜇 = 12
Alternative Hypothesis 𝐻
This is the hypothesis that will be adopted if the test rejects the null hypothesis 𝐻 .
It is written as 𝐻 :
For Example: , if our 𝐻 : 𝜇 = 12 then our 𝐻 : 𝜇 ≠ 12
The Process of Hypothesis Testing
1. Formulate the hypothesis that is, state 𝐻 and 𝐻
2. Specify the significant level whether it is 1% or 5% or 10%
3. Set up the acceptance range based on the specified significance level
4. Calculate the sample test statistic
5. Decide whether to reject the null hypothesis
6. State the conclusion
Type Ι Error
This is the probability of rejecting the null hypothesis when in fact it is true
Type ΙΙ Error
This is the probability of accepting the null hypothesis when in fact it is false
, 47
Level of Significance
The maximum probability which we are willing to risk to wrongly reject 𝐻 . The level of
significance 𝛼 is used to find the cut-off points which separate the area of acceptance
from the area of rejection.
Critical Values
The critical value 𝑧 is the number of standard deviations which will indicate whether
to reject 𝐻 𝑎𝑛𝑑 𝑎𝑐𝑐𝑒𝑝𝑡 𝐻 .
Two Tailed Test
𝐻 :𝜇 = 𝜇
𝐻 :𝜇 ≠ 𝜇
The alternative hypothesis is two sided, both large and small values of z lead us to
reject the null hypothesis.
The rejection region comprises all values of z in the left and right-hand tails of the
standard normal distribution which have a total area of 𝛼 as shown below