

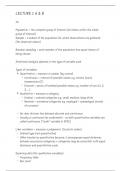
LECTURE 1 A & B
1A
Population = the complete group of interest (all values within the whole
group of interest)
Sample = a subset of the population for which observations are gathered
(the observed values)
Random sampling = each member of the population has equal chance of
being chosen
Statistical analysis depends in the type of variable used
Types of variables:
● Quantitative = measure a number (by nature)
○ Continuous = interval of possible values e.g. income (euro),
temperature (C)
○ Discrete = series of isolated possible values e.g. number of cars (1, 2,
3, ….)
● Qualitative = measure a category
○ Ordinal = ordered categories e.g. small, medium, large drink
○ Nominal = unordered categories e.g. employed / unemployed, brands
of a product
– No clear division line between discrete and continuous
– Usually a continuum lies underneath - so both quantitative variables are
called continuous (“scale” variable in SPSS)
Liker variables = measure a judgement (5 points scales)
– Ordinal type (not quantitative)
– Often treated as quantitative because: it presupposes equal distances
between successive categories + categories may be consistent with equal
distances and quantitative scale
Exploring data (for qualitative variables):
– Frequency table
– Bar chart
, – Pie chart
– Mode
– Median (for ordinal data)
Explorign data (for quantitative variables):
– Histogram
– Mode, range
– Mean, SD, skewness, kurtosis
– Z-scores
– Percentiles, quartiles, box plot
Quantitative variables examples:
– Accounting: liquidity ratio, solvency ratio, profit, turnover, VAT
– Operations: production volume, productivity, delivery time
– Human Resources: # employees, # vacancies, training costs
– Marketing: advertising costs, product price
Histograms provide info about the distribution of values:
. Location (central value)
. Spread (variability - dispersion)
. Skewness (lack of symmetry)
. Kurtosis (long/thick tails versus soft/thing tails)
1A
Population = the complete group of interest (all values within the whole
group of interest)
Sample = a subset of the population for which observations are gathered
(the observed values)
Random sampling = each member of the population has equal chance of
being chosen
Statistical analysis depends in the type of variable used
Types of variables:
● Quantitative = measure a number (by nature)
○ Continuous = interval of possible values e.g. income (euro),
temperature (C)
○ Discrete = series of isolated possible values e.g. number of cars (1, 2,
3, ….)
● Qualitative = measure a category
○ Ordinal = ordered categories e.g. small, medium, large drink
○ Nominal = unordered categories e.g. employed / unemployed, brands
of a product
– No clear division line between discrete and continuous
– Usually a continuum lies underneath - so both quantitative variables are
called continuous (“scale” variable in SPSS)
Liker variables = measure a judgement (5 points scales)
– Ordinal type (not quantitative)
– Often treated as quantitative because: it presupposes equal distances
between successive categories + categories may be consistent with equal
distances and quantitative scale
Exploring data (for qualitative variables):
– Frequency table
– Bar chart
, – Pie chart
– Mode
– Median (for ordinal data)
Explorign data (for quantitative variables):
– Histogram
– Mode, range
– Mean, SD, skewness, kurtosis
– Z-scores
– Percentiles, quartiles, box plot
Quantitative variables examples:
– Accounting: liquidity ratio, solvency ratio, profit, turnover, VAT
– Operations: production volume, productivity, delivery time
– Human Resources: # employees, # vacancies, training costs
– Marketing: advertising costs, product price
Histograms provide info about the distribution of values:
. Location (central value)
. Spread (variability - dispersion)
. Skewness (lack of symmetry)
. Kurtosis (long/thick tails versus soft/thing tails)


