4/16/25, 1:02 AM Gurleen Bajwa - AFF811/FIN801 011 - Financial Risk Management - W2025 - Toronto Metropolitan University
Review Quiz 5 - Results X
Attempt 1 of 1
Written Feb 14, 2025 6:12 PM - Feb 14, 2025 6:39 PM
Attempt Score 81.25 %
Overall Grade (Highest Attempt) 81.25 %
Question 1 points
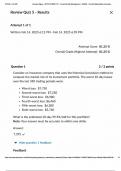
Consider an insurance company that uses the historical simulation method to
compute the market risk of its investment portfolio. The worst 10-day losses
over the last 350 trading periods were:
o Worst loss: $7,750
Second-worst loss: $7,250
Third-worst loss: $6,980
Fourth-worst loss: $6,460
Fifth-worst loss: $6,380
Sixth-worst loss: $5,760
What is the estimated 10-day 99.5% VaR for this portfolio?
Note: Your answer must be accurate to within one dollar.
Answer:
7,375 &/
W Hide question 1 feedback
Feedback
https://courses.torontomu.ca/d2l/Ims/quizzing/user/quiz_submissions_attempt.d21?isprv=&qi=441868&ai=10408747&isInPopup=0&cfql=0&fromQB=0&... 117
, 4/16/25, 1:02 AM Gurleen Bajwa - AFF811/FIN801 011 - Financial Risk Management - W2025 - Toronto Metropolitan University
The appropriate calculations are:
0.5% cutoff = .005 x 350 =1.75
VaR(10-day, 99.5%) = .25 x Worst loss + .75 x Second-worst loss
Question 2 points
Consider a bank that uses the historical simulation method to compute
market risk of its trading portfolio. The worst 10-day returns over the last 300
trading days were:
e Worst loss: $5,000
« Second-worst loss: $4,960
e Third-worst loss: $4,800
e Fourth-worst loss: $4,420
« Fifth-worst loss: $4,320
« Sixth-worst loss: $4,120
e Seventh-worst loss: $3,940
« Eighth-worst loss: $3,760
« Ninth-worst return: $3,580
What is the estimated 10-day 97.5% ES for this portfolio?
Note: Your answer must be accurate to within one dollar.
Answer:
4,859 % (4,458.67)
w Hide question 2 feedback
Feedback
The appropriate calculations are:
2.5% cutoff = .025 x 300 = 7.5
ES(10-day,27.5%) = (Worst loss + Second-worst loss + Third-worst loss +
https://courses.torontomu.ca/d2l/Ims/quizzing/user/quiz_submissions_attempt.d21?isprv=&qi=441868&ai=10408747 &isInPopup=0&cfql=0&fromQB=0&... 27
Review Quiz 5 - Results X
Attempt 1 of 1
Written Feb 14, 2025 6:12 PM - Feb 14, 2025 6:39 PM
Attempt Score 81.25 %
Overall Grade (Highest Attempt) 81.25 %
Question 1 points
Consider an insurance company that uses the historical simulation method to
compute the market risk of its investment portfolio. The worst 10-day losses
over the last 350 trading periods were:
o Worst loss: $7,750
Second-worst loss: $7,250
Third-worst loss: $6,980
Fourth-worst loss: $6,460
Fifth-worst loss: $6,380
Sixth-worst loss: $5,760
What is the estimated 10-day 99.5% VaR for this portfolio?
Note: Your answer must be accurate to within one dollar.
Answer:
7,375 &/
W Hide question 1 feedback
Feedback
https://courses.torontomu.ca/d2l/Ims/quizzing/user/quiz_submissions_attempt.d21?isprv=&qi=441868&ai=10408747&isInPopup=0&cfql=0&fromQB=0&... 117
, 4/16/25, 1:02 AM Gurleen Bajwa - AFF811/FIN801 011 - Financial Risk Management - W2025 - Toronto Metropolitan University
The appropriate calculations are:
0.5% cutoff = .005 x 350 =1.75
VaR(10-day, 99.5%) = .25 x Worst loss + .75 x Second-worst loss
Question 2 points
Consider a bank that uses the historical simulation method to compute
market risk of its trading portfolio. The worst 10-day returns over the last 300
trading days were:
e Worst loss: $5,000
« Second-worst loss: $4,960
e Third-worst loss: $4,800
e Fourth-worst loss: $4,420
« Fifth-worst loss: $4,320
« Sixth-worst loss: $4,120
e Seventh-worst loss: $3,940
« Eighth-worst loss: $3,760
« Ninth-worst return: $3,580
What is the estimated 10-day 97.5% ES for this portfolio?
Note: Your answer must be accurate to within one dollar.
Answer:
4,859 % (4,458.67)
w Hide question 2 feedback
Feedback
The appropriate calculations are:
2.5% cutoff = .025 x 300 = 7.5
ES(10-day,27.5%) = (Worst loss + Second-worst loss + Third-worst loss +
https://courses.torontomu.ca/d2l/Ims/quizzing/user/quiz_submissions_attempt.d21?isprv=&qi=441868&ai=10408747 &isInPopup=0&cfql=0&fromQB=0&... 27