

Beauponte Mezonlin
ETM 620
Final Exam
Problem 1
1.) 1. Recent studies show that high sound level (in decibels) makes humans prone to
hypertension and heart attacks. For example, normal conversation level is 60 dB, for textile looms
it is 105 dB, and for pneumatic chippers it is 115 dB. The accompanying coded data give the
noise level and the hypertension for people who work in noisy places. Using this data: (10
points)
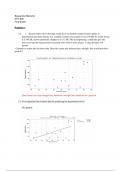
Construct a scatter plot for these data. Does the scatter plot indicate that a straight‐line would provide a
good fit?
Since there is no clear straight line, therefore a straight line would not be a good fit.
2.) Fit a regression line to these data for predicting the hypertension level
of a person.
, Here we can see that the all the points does not lies on the straight line
The regression equation is
Hypertension = 45.06 + 1.061 Noise Level
Problem 2
1.) The researcher in the hypertension study observed 100 individuals and believes the
average coded hypertension of the individuals is greater than 77. The average coded
hypertension is 77.2 with a standard deviation of 1.5. (10 points) 1. Is the researcher’s
claim statistically valid? List all metrics used to draw your conclusion
P value is greater than alpha so we fail to reject the null . Our final conclusion is that the researcher's
claim is statistically valid.
2.) Calculate a 95% confidence interval for the coded hypertension value.
The 95% confidence Interval will be : (76.906,77.494)
Problem 3
1.)
The pull strength of a wire bond is an important characteristic as it pertains to quality. The
accompanying data file gives information on pull strength, die height, post height, loop height ,
wire length, bond width on the die, and bond width on the post. Use the information to answer the
following questions. (35 points) 1. Develop a model to predict pull strength based on die height,
post height, loop height , wire length, bond width on the die, and bond width on the post
ETM 620
Final Exam
Problem 1
1.) 1. Recent studies show that high sound level (in decibels) makes humans prone to
hypertension and heart attacks. For example, normal conversation level is 60 dB, for textile looms
it is 105 dB, and for pneumatic chippers it is 115 dB. The accompanying coded data give the
noise level and the hypertension for people who work in noisy places. Using this data: (10
points)
Construct a scatter plot for these data. Does the scatter plot indicate that a straight‐line would provide a
good fit?
Since there is no clear straight line, therefore a straight line would not be a good fit.
2.) Fit a regression line to these data for predicting the hypertension level
of a person.
, Here we can see that the all the points does not lies on the straight line
The regression equation is
Hypertension = 45.06 + 1.061 Noise Level
Problem 2
1.) The researcher in the hypertension study observed 100 individuals and believes the
average coded hypertension of the individuals is greater than 77. The average coded
hypertension is 77.2 with a standard deviation of 1.5. (10 points) 1. Is the researcher’s
claim statistically valid? List all metrics used to draw your conclusion
P value is greater than alpha so we fail to reject the null . Our final conclusion is that the researcher's
claim is statistically valid.
2.) Calculate a 95% confidence interval for the coded hypertension value.
The 95% confidence Interval will be : (76.906,77.494)
Problem 3
1.)
The pull strength of a wire bond is an important characteristic as it pertains to quality. The
accompanying data file gives information on pull strength, die height, post height, loop height ,
wire length, bond width on the die, and bond width on the post. Use the information to answer the
following questions. (35 points) 1. Develop a model to predict pull strength based on die height,
post height, loop height , wire length, bond width on the die, and bond width on the post


