

Theme 3 Topic 6
Quantitative Sales Forecasting
Quantitative Sales Forecasting
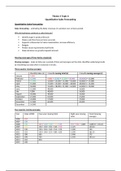
Sales forecasting – estimating the likely revenues of a product over a future period.
Why do businesses construct a sales forecast?
Identify stage in product lifecycle
Makes cash flow forecast more accurate
Supports achievement of sales maximisation, increase efficiency
Budgets
Predict stock requirements/staff levels
Make decisions on growth/expand/retrench
Moving Averages (Time-Series Analysis)
Moving averages – looks at data over a period of time and averages out the data. Identifies underlying trends
by smoothing out data which is seasonal or erratic.
Three quarter moving averages:
Monthly Sales (£) 3 month moving total (£) 3 month moving average (£)
January 9,000
February 12,000 9,000 + 12,000 + 15,000 = 36,000 36,000/3 = 12,000
March 15,000 12,000 + 15,000 + 15,000 = 42,000 42,000/3 = 14,000
April 15,000 15,000 + 15,000 + 18,000 = 48,000 48,000/3 = 16,000
May 18,000 15,000 + 18,000 + 21,000 = 54,000 54,000/3 = 18,000
June 21,000 48,000 16,000
July 9,000 48,000 16,000
August 18,000 48,000 16,000
September 21,000 63,000 21,000
October 24,000 57,000 19,000
November 12,000 60,000 20,000
December 24,000
Four quarter moving averages:
Year Sales (£000) Four-year moving total Eight-year moving Trend (moving
total average)
2006 125
2007 130
2008 130 125 + 130 + 130 + 150 = 535 535 + 550 = 1,085 1,085/8 = 135.63
2009 150 130 + 130 + 150 + 140 = 550 1,125 140.63
2010 140 130 + 150 + 140 + 155 = 575 1,200 150
2011 155 150 + 140 + 155 + 180 = 625 1,290 161.25
2012 180 665 1,400 175
2013 190 735 1,545 193.13
2014 210 810
2015 230
Quantitative Sales Forecasting
Quantitative Sales Forecasting
Sales forecasting – estimating the likely revenues of a product over a future period.
Why do businesses construct a sales forecast?
Identify stage in product lifecycle
Makes cash flow forecast more accurate
Supports achievement of sales maximisation, increase efficiency
Budgets
Predict stock requirements/staff levels
Make decisions on growth/expand/retrench
Moving Averages (Time-Series Analysis)
Moving averages – looks at data over a period of time and averages out the data. Identifies underlying trends
by smoothing out data which is seasonal or erratic.
Three quarter moving averages:
Monthly Sales (£) 3 month moving total (£) 3 month moving average (£)
January 9,000
February 12,000 9,000 + 12,000 + 15,000 = 36,000 36,000/3 = 12,000
March 15,000 12,000 + 15,000 + 15,000 = 42,000 42,000/3 = 14,000
April 15,000 15,000 + 15,000 + 18,000 = 48,000 48,000/3 = 16,000
May 18,000 15,000 + 18,000 + 21,000 = 54,000 54,000/3 = 18,000
June 21,000 48,000 16,000
July 9,000 48,000 16,000
August 18,000 48,000 16,000
September 21,000 63,000 21,000
October 24,000 57,000 19,000
November 12,000 60,000 20,000
December 24,000
Four quarter moving averages:
Year Sales (£000) Four-year moving total Eight-year moving Trend (moving
total average)
2006 125
2007 130
2008 130 125 + 130 + 130 + 150 = 535 535 + 550 = 1,085 1,085/8 = 135.63
2009 150 130 + 130 + 150 + 140 = 550 1,125 140.63
2010 140 130 + 150 + 140 + 155 = 575 1,200 150
2011 155 150 + 140 + 155 + 180 = 625 1,290 161.25
2012 180 665 1,400 175
2013 190 735 1,545 193.13
2014 210 810
2015 230


