ALL 18 CHAPTERS COVERED
SOLUTIONS MANUAL
,Contents
1 Introduction to Statistics and Data Analysis 1
2 Probability 11
3 Random Variables and Probability Distributions 29
4 Mathematical Expectation 45
5 Some Discrete Probability Distributions 59
6 Some Continuous Probability Distributions 71
7 Functions of Random Variables 85
8 Fundamental Sampling Distributions and Data Descriptions 91
9 One- and Two-Sample Estimation Problems 103
10 One- and Two-Sample Tests of Hypotheses 121
11 Simple Linear Regression and Correlation 149
12 Multiple Linear Regression and Certain Nonlinear Regression Models 171
13 One-Factor Experiments: General 185
14 Factorial Experiments (Two or More Factors) 213
15 2k Factorial Experiments and Fractions 237
16 Nonparametric Statistics 257
iii
,iv CONTENTS
17 Statistical Quality Control 273
18 Bayesian Statistics 277
, Chapter 1
Introduction to Statistics and Data
Analysis
1.1 (a) 15.
1
(b) x̄ = 15
(3.4 + 2.5 + 4.8 + · · · + 4.8) = 3.787.
(c) Sample median is the 8th value, after the data is sorted from smallest to largest:
3.6.
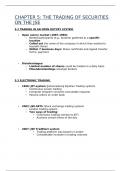
(d) A dot plot is shown below.
2.5 3.0 3.5 4.0 4.5 5.0 5.5
(e) After trimming total 40% of the data (20% highest and 20% lowest), the data
becomes:
2.9 3.0 3.3 3.4 3.6
3.7 4.0 4.4 4.8
So. the trimmed mean is
1
x̄tr20 = (2.9 + 3.0 + · · · + 4.8) = 3.678.
9
1.2 (a) Mean=20.768 and Median=20.610.
(b) x̄tr10 = 20.743.
(c) A dot plot is shown below.
18 19 20 21 22 23
1
SOLUTIONS MANUAL
,Contents
1 Introduction to Statistics and Data Analysis 1
2 Probability 11
3 Random Variables and Probability Distributions 29
4 Mathematical Expectation 45
5 Some Discrete Probability Distributions 59
6 Some Continuous Probability Distributions 71
7 Functions of Random Variables 85
8 Fundamental Sampling Distributions and Data Descriptions 91
9 One- and Two-Sample Estimation Problems 103
10 One- and Two-Sample Tests of Hypotheses 121
11 Simple Linear Regression and Correlation 149
12 Multiple Linear Regression and Certain Nonlinear Regression Models 171
13 One-Factor Experiments: General 185
14 Factorial Experiments (Two or More Factors) 213
15 2k Factorial Experiments and Fractions 237
16 Nonparametric Statistics 257
iii
,iv CONTENTS
17 Statistical Quality Control 273
18 Bayesian Statistics 277
, Chapter 1
Introduction to Statistics and Data
Analysis
1.1 (a) 15.
1
(b) x̄ = 15
(3.4 + 2.5 + 4.8 + · · · + 4.8) = 3.787.
(c) Sample median is the 8th value, after the data is sorted from smallest to largest:
3.6.
(d) A dot plot is shown below.
2.5 3.0 3.5 4.0 4.5 5.0 5.5
(e) After trimming total 40% of the data (20% highest and 20% lowest), the data
becomes:
2.9 3.0 3.3 3.4 3.6
3.7 4.0 4.4 4.8
So. the trimmed mean is
1
x̄tr20 = (2.9 + 3.0 + · · · + 4.8) = 3.678.
9
1.2 (a) Mean=20.768 and Median=20.610.
(b) x̄tr10 = 20.743.
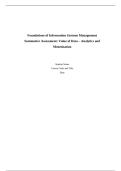
(c) A dot plot is shown below.
18 19 20 21 22 23
1