
• Wrong document? Swap it for free
  • Written by students who passed
  • Immediately available after payment
  • Read online or as PDF
Sell
Where do you study
Your language
Document preview thumbnail
Preview 1 out of 2 pages
Summary

Summary Introductory Statistics For Business – Chapter 1 & 2 Study Guide + Practice

Document preview thumbnail
Preview 1 out of 2 pages

A concise cheat sheet explaining qualitative vs. quantitative data, and the basics of mean, median, and mode Clear definitions and examples of frequency tables and histograms Visual representation of test score distribution using a histogram Definitions and formulas for mean, median, mode, range, IQR, variance, and standard deviation Two fully solved example problems with step-by-step calculations Shortcuts and rules of thumb to help determine when to use which measure Created for students in STA 2023, STAT 101, MATH 1040, or AP/CLEP equivalents Great for majors in Business, Social Sciences, Education, or Health Sciences Based on popular textbooks like Sullivan, McClave and Starnes/Yates/Moore Matches content in McClave’s Stats for Business & Economics and The Practice of Statistics by Starnes Great for review, assignments, and exam prep — designed for quick understanding and success.

Content preview

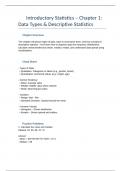
📊 Introductory Statistics – Chapter 1:
Data Types & Descriptive Statistics
📖 Chapter Overview

This chapter introduces types of data, ways to summarize them, and key concepts in
descriptive statistics. You’ll learn how to organize data into frequency distributions,
calculate central tendencies (mean, median, mode), and understand data spread using
visualizations.


🧾 Cheat Sheet

- Types of Data:
• Qualitative: Categories or labels (e.g., gender, brand)
• Quantitative: Numerical values (e.g., height, age)

- Central Tendency:
• Mean: Average value
• Median: Middle value when ordered
• Mode: Most frequent value

- Variation:
• Range: Max - Min
• Standard Deviation: Spread around the mean

- Common Visuals:
• Histogram – Shows distribution
• Boxplot – Shows spread and outliers


🧠 Practice Problems
1. Calculate the mean and median:
Dataset: 62, 65, 68, 70, 72

Answer:
- Mean = (62+65+68+70+72)/5 = 67.4
- Median = 68

Connected book
 image
Michael Sullivan (III) Statistics
Publisher: 2017 ISBN: 9780134135373 Edition: Unknown

Document information

Summarized whole book?
No
Which chapters are summarized?
Ch1-2
Uploaded on
April 23, 2025
File latest updated on
April 23, 2025
Number of pages
2
Written in
2024/2025
Type
Summary
$7.49

Wrong document? Swap it for free Within 14 days of purchase and before downloading, you can choose a different document. You can simply spend the amount again.
Written by students who passed
Immediately available after payment
Read online or as PDF

Sold
0
Followers
0
Items
2
Last sold
-


Why students choose Stuvia

Created by fellow students, verified by reviews

Quality you can trust: written by students who passed their tests and reviewed by others who've used these notes.

Didn't get what you expected? Choose another document

No worries! You can instantly pick a different document that better fits what you're looking for.

Pay as you like, start learning right away

No subscription, no commitments. Pay the way you're used to via credit card and download your PDF document instantly.

Student with book image

“Bought, downloaded, and aced it. It really can be that simple.”

Alisha Student

Working on your references?

Create accurate citations in APA, MLA and Harvard with our free citation generator.

Working on your references?

Frequently asked questions

