Portage Math 110 Elementary Statistics (Module 2)
Study online at https://quizlet.com/_anwnhm
1. frequency distrib- A tabular summary of data showing the number (frequency) of observations in
ution each of several distinctive (nonoverlapping) categories or classes.
2. relative frequen- A ratio that compares the frequency of each category to the total.
cy frequency of the class / n where n = total count of all classes
3. relative percent- percentage of time the value occurs in the sample or population
age relative frequency x 100
4. charting a means to represent frequencies visually
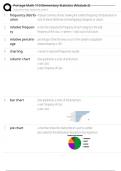
5. column chart Data graphed as a series of vertical bars
x-axis: class
y-axis: frequency of class
6. bar chart Data graphed as a series of horizontal bars
x-axis: frequency of class
y-axis: class
7. pie chart a chart that shows the relationship of a part to a whole
best suited for the distributions focused on the proportions
1/6
, Portage Math 110 Elementary Statistics (Module 2)
Study online at https://quizlet.com/_anwnhm
8. 3 step method to 1. determine the number of classes to be evaluated
group numerical 2. determine the width of each class
data into classes 3. determine the limits of each class
9. Number of class- (usu b/w 5 and 20)
es less than 25 > 5 to 6
25 to 50 > 7 to 14
More than 50 > 15-20
10. Width of class approx width =
(largest data value - smallest data value) / # of classes
11. qualitative data frequency distributions
relative frequency distributions
percent frequency distributions
Graphical: bar, column, pie charts
12. quantitative data frequency distributions
relative frequency distributions
percent frequency distributions
Graphical: histograms
13. positive relation- an association between two variables in which they increase or decrease together
ship
14. negative relation- an association between two variables in which one increases while the other
ship decreases
2/6
Study online at https://quizlet.com/_anwnhm
1. frequency distrib- A tabular summary of data showing the number (frequency) of observations in
ution each of several distinctive (nonoverlapping) categories or classes.
2. relative frequen- A ratio that compares the frequency of each category to the total.
cy frequency of the class / n where n = total count of all classes
3. relative percent- percentage of time the value occurs in the sample or population
age relative frequency x 100
4. charting a means to represent frequencies visually
5. column chart Data graphed as a series of vertical bars
x-axis: class
y-axis: frequency of class
6. bar chart Data graphed as a series of horizontal bars
x-axis: frequency of class
y-axis: class
7. pie chart a chart that shows the relationship of a part to a whole
best suited for the distributions focused on the proportions
1/6
, Portage Math 110 Elementary Statistics (Module 2)
Study online at https://quizlet.com/_anwnhm
8. 3 step method to 1. determine the number of classes to be evaluated
group numerical 2. determine the width of each class
data into classes 3. determine the limits of each class
9. Number of class- (usu b/w 5 and 20)
es less than 25 > 5 to 6
25 to 50 > 7 to 14
More than 50 > 15-20
10. Width of class approx width =
(largest data value - smallest data value) / # of classes
11. qualitative data frequency distributions
relative frequency distributions
percent frequency distributions
Graphical: bar, column, pie charts
12. quantitative data frequency distributions
relative frequency distributions
percent frequency distributions
Graphical: histograms
13. positive relation- an association between two variables in which they increase or decrease together
ship
14. negative relation- an association between two variables in which one increases while the other
ship decreases
2/6