Please write clearly in block capitals.
Centre number Candidate number
Surname
Forename(s)
Candidate signatuure
I declare this is my own work.
AQA AS
LEVEL
physics
paper 2
For Examiner’s Use
Question Mark
1
2
Materials 3
For this paper you must have:
4
a pencil and a ruler
a scientific calculator 5
a Data and Formulae Booklet 6–35
a protractor.
TOTAL
Instructions
Use black ink or black ball-point pen.
Fill in the boxes at the top of this page.
Answer all questions.
You must answer the questions in the spaces provided. Do not write You are expected
outside the box around each page or on blank pages. to use a scientific
If you need extra space for your answer(s), use the lined pages at the end of calculator where
this book. Write the question number against your answer(s). appropriate.
Do all rough work in this book. Cross through any work you do not want A Data and
to be marked. Formulae Booklet
Show all your working. is provided as a
loose insert.
Information
The marks for questions are shown in brackets.
The maximum mark for this paper is 70.
,Time:1
hr
30min.
,PP P
Answer ALLSection
questions
A in this section.
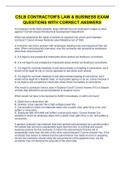
0 1 A student investigates stationary waves using microwaves.
Figure 1 shows a metre ruler fixed to a bench. The student places a microwave
transmitter T at one end of the ruler and a vertical metal reflector R at the other end.
R is at a right angle to the ruler.
Figure 1
The student places a microwave detector D approximately one-third of the distance
from T to R. When T is switched off, the microammeter connected to D reads zero.
When T is switched on, stationary waves are produced between T and R, and the
microammeter registers a current. When the student moves D along the ruler, the
size of the current changPes between maximum and minimum values.
PPP
, P
PP
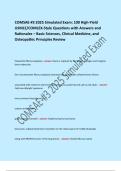
The student measures the current at different positions of D along the ruler to identify A
a position P of the minimum current. P
E
Figure 2 is a plot of the measurements taken near P. R
Figure 2 2
0 1
. 1 Draw a line of best fit for these data.
[2 marks]
0 1
. 2 State a value for the position of P.
[1 mark]
position of P = cm
Question 1 continues on the next page
P
Centre number Candidate number
Surname
Forename(s)
Candidate signatuure
I declare this is my own work.
AQA AS
LEVEL
physics
paper 2
For Examiner’s Use
Question Mark
1
2
Materials 3
For this paper you must have:
4
a pencil and a ruler
a scientific calculator 5
a Data and Formulae Booklet 6–35
a protractor.
TOTAL
Instructions
Use black ink or black ball-point pen.
Fill in the boxes at the top of this page.
Answer all questions.
You must answer the questions in the spaces provided. Do not write You are expected
outside the box around each page or on blank pages. to use a scientific
If you need extra space for your answer(s), use the lined pages at the end of calculator where
this book. Write the question number against your answer(s). appropriate.
Do all rough work in this book. Cross through any work you do not want A Data and
to be marked. Formulae Booklet
Show all your working. is provided as a
loose insert.
Information
The marks for questions are shown in brackets.
The maximum mark for this paper is 70.
,Time:1
hr
30min.
,PP P
Answer ALLSection
questions
A in this section.
0 1 A student investigates stationary waves using microwaves.
Figure 1 shows a metre ruler fixed to a bench. The student places a microwave
transmitter T at one end of the ruler and a vertical metal reflector R at the other end.
R is at a right angle to the ruler.
Figure 1
The student places a microwave detector D approximately one-third of the distance
from T to R. When T is switched off, the microammeter connected to D reads zero.
When T is switched on, stationary waves are produced between T and R, and the
microammeter registers a current. When the student moves D along the ruler, the
size of the current changPes between maximum and minimum values.
PPP
, P
PP
The student measures the current at different positions of D along the ruler to identify A
a position P of the minimum current. P
E
Figure 2 is a plot of the measurements taken near P. R
Figure 2 2
0 1
. 1 Draw a line of best fit for these data.
[2 marks]
0 1
. 2 State a value for the position of P.
[1 mark]
position of P = cm
Question 1 continues on the next page
P