Inhoudsopgave
Principal Component Analysis (PCA) ............................................................................................................... 2
Analysis Of variance ........................................................................................................................................ 5
ANOVA ........................................................................................................................................................... 5
ANCOVA ......................................................................................................................................................... 7
Regression ...................................................................................................................................................... 7
Bivariate Regression ....................................................................................................................................... 7
Multiple Regression ........................................................................................................................................ 9
Binairy regression ......................................................................................................................................... 10
Lineair probability model: ................................................................................................................................. 10
Logistic Regression ........................................................................................................................................... 11
Moderation analysis ..................................................................................................................................... 12
Mediation Analysis ....................................................................................................................................... 14
Cluster Analysis............................................................................................................................................. 16
,In marketing research, we often use multiple-item scales to measure complex ideas like attitudes or
lifestyles. This means asking several similar questions about the same concept.
However, using many similar items can create issues:
• Multicollinearity: When items overlap too much, it’s hard to tell their effects apart because
they’re highly related.
• Complexity: Having many overlapping items makes the data harder to analyze and interpret.
Using multiple questions is good to get the underlying construct but to analyze these you have to
combine them.
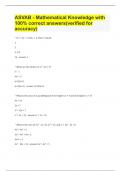
Standardize the data:
For the methods to work we need standardize the data, we are going to
standardize so much that we get an average (mean) of 0 and a variance
of 1 (standard deviation). We want to do this because, depending how
you measure things, they might get a different weight in the data. E.g.
when you want to compare something that is measured on a 1 to 5
scale and you want to compare it with something that is measured on a
1 to 100 scale. The one to 100 gets more “weight” in the analysis and
that is not something you want.
Standardizing = all variables are expressed in the exact same way and get the same weight in the
analysis.
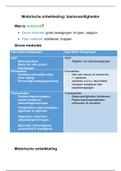
Correlation between variables:
To what extend are the variables correlated with each other and to what extend are they going into
the same direction?
What to do with missing values or weird values:
1. Listwise deletion > delete the entire observation
2. Pairwise deletion > you will delete the observation only for the analysis of that/those
specific variables.
3. Replace value (imputation) > you can replace the missing variable for example with the
average value of the others.
The different analysis:
Principal Component Analysis (PCA) = Looking for uncorrelated dimensions that capture
maximal variance in the data.
• We want as few variables as possible with as much information as possible.
• Often used to create perceptual maps
How:
- Standardize variables (mean is 0 and variance (sd) is 1
- Total variability is all variables
- Retain only the strongest components:
, Sometimes the output is not easy to interpretate because the main goal is reduction, when we have
almost equal components, we do a rotation:
- Orthogonal rotation > to get stronger relation with the dimensions (the dimensions are
uncorrelated)
- Oblique rotation > the components are no longer uncorrelated (only use when you want
correlation)
Rotation alters the structure of loadings to increase interpretability without changing the
underlying shared variance (communalities) of the variables.
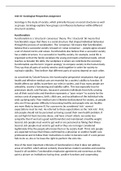
- You choose the highest score and name the components.
Important: by taking the average of all components we get data that is much easier to interpretate.
When you do a factor component analyses again you can get different results, maybe less final
components
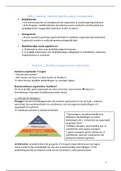
> In this graph we can see how much of the variance of each variable is
explained within the two components. All are quite high.
Factor loading = Correlation between an original variable and a latent factor.
How to calculate the eigenvalue = sum all (components)^2 / total of the original variables
(standardized) on that component.
Eigenvalue = amount of variability explained by each component
How to calculate communality = sum all (components)^2 / total of the original (standardized)
variables.
Communality = amount of variability explained of each variable.
2. Exploratory Factor Analyis (EFA) = Looking for a small number of dimensions that
capture a large part of the variance. Factors are latent variables that cannot be observed directly.
Latent Variables are variables that we assume exist but cannot measure directly. In EFA, these are
the factors they represent underlying traits or constructs that we believe influence the data but are
not directly observed. For example, if you’re studying psychological traits, factors could represent
concepts like "intelligence" or "anxiety," which cannot be measured directly. Interpretation is even
more important than the reduction we do in the principle component analysis.
Manifest variables = the actual variable you measure and observe. An example: individual test scores
(manifest variables) might be influenced by the underlying trait of "intelligence" (latent variable).
Principal Component Analysis (PCA) ............................................................................................................... 2
Analysis Of variance ........................................................................................................................................ 5
ANOVA ........................................................................................................................................................... 5
ANCOVA ......................................................................................................................................................... 7
Regression ...................................................................................................................................................... 7
Bivariate Regression ....................................................................................................................................... 7
Multiple Regression ........................................................................................................................................ 9
Binairy regression ......................................................................................................................................... 10
Lineair probability model: ................................................................................................................................. 10
Logistic Regression ........................................................................................................................................... 11
Moderation analysis ..................................................................................................................................... 12
Mediation Analysis ....................................................................................................................................... 14
Cluster Analysis............................................................................................................................................. 16
,In marketing research, we often use multiple-item scales to measure complex ideas like attitudes or
lifestyles. This means asking several similar questions about the same concept.
However, using many similar items can create issues:
• Multicollinearity: When items overlap too much, it’s hard to tell their effects apart because
they’re highly related.
• Complexity: Having many overlapping items makes the data harder to analyze and interpret.
Using multiple questions is good to get the underlying construct but to analyze these you have to
combine them.
Standardize the data:
For the methods to work we need standardize the data, we are going to
standardize so much that we get an average (mean) of 0 and a variance
of 1 (standard deviation). We want to do this because, depending how
you measure things, they might get a different weight in the data. E.g.
when you want to compare something that is measured on a 1 to 5
scale and you want to compare it with something that is measured on a
1 to 100 scale. The one to 100 gets more “weight” in the analysis and
that is not something you want.
Standardizing = all variables are expressed in the exact same way and get the same weight in the
analysis.
Correlation between variables:
To what extend are the variables correlated with each other and to what extend are they going into
the same direction?
What to do with missing values or weird values:
1. Listwise deletion > delete the entire observation
2. Pairwise deletion > you will delete the observation only for the analysis of that/those
specific variables.
3. Replace value (imputation) > you can replace the missing variable for example with the
average value of the others.
The different analysis:
Principal Component Analysis (PCA) = Looking for uncorrelated dimensions that capture
maximal variance in the data.
• We want as few variables as possible with as much information as possible.
• Often used to create perceptual maps
How:
- Standardize variables (mean is 0 and variance (sd) is 1
- Total variability is all variables
- Retain only the strongest components:
, Sometimes the output is not easy to interpretate because the main goal is reduction, when we have
almost equal components, we do a rotation:
- Orthogonal rotation > to get stronger relation with the dimensions (the dimensions are
uncorrelated)
- Oblique rotation > the components are no longer uncorrelated (only use when you want
correlation)
Rotation alters the structure of loadings to increase interpretability without changing the
underlying shared variance (communalities) of the variables.
- You choose the highest score and name the components.
Important: by taking the average of all components we get data that is much easier to interpretate.
When you do a factor component analyses again you can get different results, maybe less final
components
> In this graph we can see how much of the variance of each variable is
explained within the two components. All are quite high.
Factor loading = Correlation between an original variable and a latent factor.
How to calculate the eigenvalue = sum all (components)^2 / total of the original variables
(standardized) on that component.
Eigenvalue = amount of variability explained by each component
How to calculate communality = sum all (components)^2 / total of the original (standardized)
variables.
Communality = amount of variability explained of each variable.
2. Exploratory Factor Analyis (EFA) = Looking for a small number of dimensions that
capture a large part of the variance. Factors are latent variables that cannot be observed directly.
Latent Variables are variables that we assume exist but cannot measure directly. In EFA, these are
the factors they represent underlying traits or constructs that we believe influence the data but are
not directly observed. For example, if you’re studying psychological traits, factors could represent
concepts like "intelligence" or "anxiety," which cannot be measured directly. Interpretation is even
more important than the reduction we do in the principle component analysis.
Manifest variables = the actual variable you measure and observe. An example: individual test scores
(manifest variables) might be influenced by the underlying trait of "intelligence" (latent variable).