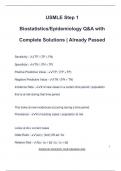
USMLE Step 1
Biostatistics/Epidemiology Q&A with
Complete Solutions | Already Passed
Sensitivity - ✔✔TP / (TP + FN)
Specificity - ✔✔TN / (TN + TP)
Positive Predictive Value - ✔✔TP / (TP + FP)
Negative Predictive Value - ✔✔TN / (FN + TN)
Incidence Rate - ✔✔# of new cases in a certain time period / population
that is at risk during that time period
This looks at new incidences occurring during a time period
Prevalence - ✔✔# of existing cases / population at risk
Looks at ALL current cases
Odds Ratio - ✔✔(a/c) / (b/d) OR ad / bc
Relative Risk - ✔✔[a / (a + b)] / [c / (c + d)]
1
©JOSHCLAY 2024/2025. YEAR PUBLISHED 2024.
, Attributable Risk - ✔✔(a / (a+b) ) - (c / (c+d) )
Gaussian curve standard deviation %'s - ✔✔+/- 1 SD = 68%
+/- 2 SD = 95%
+/- 3 SD = 99.7%
Type 1 error (alpha) - ✔✔you sAw a difference that did not really exist
(convicting an innocent man)
Type 2 error (beta) - ✔✔you were Blind to a difference that did exist
(setting a guilty man free)
Power - ✔✔1-beta or in other words, 1 - type 2 error
(increasing sample size will increase power, there is POWER in numbers.
Also, increasing Precision will increase power)
SEM - ✔✔SD / square root of n
Confidence Interval - ✔✔range from [mean - Z (SEM)] to [mean + Z (SEM)]
Z = 1.96 for 95% CI
Z = 2.58 for 99% CI
On the test, it may be easier to remember the Z values as 2 and 2.5 for
easier calculations and memorization
t - test - ✔✔checks difference between the means of 2 groups
2
©JOSHCLAY 2024/2025. YEAR PUBLISHED 2024.
Biostatistics/Epidemiology Q&A with
Complete Solutions | Already Passed
Sensitivity - ✔✔TP / (TP + FN)
Specificity - ✔✔TN / (TN + TP)
Positive Predictive Value - ✔✔TP / (TP + FP)
Negative Predictive Value - ✔✔TN / (FN + TN)
Incidence Rate - ✔✔# of new cases in a certain time period / population
that is at risk during that time period
This looks at new incidences occurring during a time period
Prevalence - ✔✔# of existing cases / population at risk
Looks at ALL current cases
Odds Ratio - ✔✔(a/c) / (b/d) OR ad / bc
Relative Risk - ✔✔[a / (a + b)] / [c / (c + d)]
1
©JOSHCLAY 2024/2025. YEAR PUBLISHED 2024.
, Attributable Risk - ✔✔(a / (a+b) ) - (c / (c+d) )
Gaussian curve standard deviation %'s - ✔✔+/- 1 SD = 68%
+/- 2 SD = 95%
+/- 3 SD = 99.7%
Type 1 error (alpha) - ✔✔you sAw a difference that did not really exist
(convicting an innocent man)
Type 2 error (beta) - ✔✔you were Blind to a difference that did exist
(setting a guilty man free)
Power - ✔✔1-beta or in other words, 1 - type 2 error
(increasing sample size will increase power, there is POWER in numbers.
Also, increasing Precision will increase power)
SEM - ✔✔SD / square root of n
Confidence Interval - ✔✔range from [mean - Z (SEM)] to [mean + Z (SEM)]
Z = 1.96 for 95% CI
Z = 2.58 for 99% CI
On the test, it may be easier to remember the Z values as 2 and 2.5 for
easier calculations and memorization
t - test - ✔✔checks difference between the means of 2 groups
2
©JOSHCLAY 2024/2025. YEAR PUBLISHED 2024.