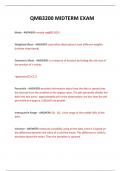
QMB3200 MIDTERM EXAM
Mode - ANSWERS-=mode.sngl(B2:B13)
Weighted Mean - ANSWERS-used when observations have different weights
(relative importance).
Geometric Mean - ANSWERS-is a measure of location by finding the nth root of
the product of n values.
=geomean(C2:C11)
Percentile - ANSWERS-provides information about how the data is spread over
the interval from the smallest to the largest value. The pth percentile divides the
data into two parts - approximately p% of the observations are less than the pth
percentile and approx. (100-p)% are greater.
Interquartile Range - ANSWERS-Q3 - Q1, is the range of the middle 50% of the
data.
Variance - ANSWERS-measures variability using all the data, since it is based on
the difference between the value of xi and the mean. This difference is called a
deviation about the mean. Then the deviation is squared.
,=var.s(B2:B13)
Standard Deviation - ANSWERS-=stdev.s(B2:B13)
Coefficient of Variation - ANSWERS-a measure of how large the standard
deviation is relative to the mean.
Distribution Shape - ANSWERS-is measured by skewness. If the shape of the data
is skewed to the left, the skewness is negative; if to the right then skewness is
positive; and if the data is symmetric, then skewness is zero.
Z-Score - ANSWERS-z-Scores use the mean and standard deviation in its
calculation. The z-Score yields a standardized value and is the number of standard
deviations from the mean.
Chebyshev's Theorem - ANSWERS-Data values must be within z standard
deviations of the mean (z > 1).
Outlier - ANSWERS-z-score greater than 3
lower limit: 𝑄𝑄1−1.5(𝐼𝐼𝑄𝑄𝐼𝐼)
upper limit: 𝑄𝑄3 + 1.5(𝐼𝐼𝑄𝑄𝐼𝐼)
,Covariance - ANSWERS-is a descriptive measure of the linear association between
two variables.
Dataset - ANSWERS-all the data collected for a particular analysis.
Element - ANSWERS-the entity on which data is collected.
Observation - ANSWERS-the variables associated with an individual element.
Variable - ANSWERS-a characteristic of interest of an element.
Categorical Data - ANSWERS-use numeric or ordinal values of measurement of
categories.
Cross-Sectional Data - ANSWERS-data collected at a similar point in time.
Time Series - ANSWERS-data collected over several time periods.
Panel - ANSWERS-combination of cross-sectional and time series data.
Population - ANSWERS-is the set of all data/variables of a statistical analysis.
, Sample - ANSWERS-subset of the population.
Frequency Formula - ANSWERS-=countif(highlight column, select cell)
Percent Frequency - ANSWERS-=cell/sum(cell range)
Descriptive Analytics - ANSWERS-which describe what has happened in the past.
Predictive Analytics - ANSWERS-uses statistical models from past data to predict
the future forecasting or access the impact of one variable on another inference.
Prescriptive Analytics - ANSWERS-uses models seeking to find a best optimal
solution. Often these are some type of optimization model.
Veracity - ANSWERS-the reliability of the data generated.
Data Mining - ANSWERS-Focuses on extracting predictive information from big
data.
Big Data - ANSWERS-Volume
Velocity
Variety
Veracity
Mode - ANSWERS-=mode.sngl(B2:B13)
Weighted Mean - ANSWERS-used when observations have different weights
(relative importance).
Geometric Mean - ANSWERS-is a measure of location by finding the nth root of
the product of n values.
=geomean(C2:C11)
Percentile - ANSWERS-provides information about how the data is spread over
the interval from the smallest to the largest value. The pth percentile divides the
data into two parts - approximately p% of the observations are less than the pth
percentile and approx. (100-p)% are greater.
Interquartile Range - ANSWERS-Q3 - Q1, is the range of the middle 50% of the
data.
Variance - ANSWERS-measures variability using all the data, since it is based on
the difference between the value of xi and the mean. This difference is called a
deviation about the mean. Then the deviation is squared.
,=var.s(B2:B13)
Standard Deviation - ANSWERS-=stdev.s(B2:B13)
Coefficient of Variation - ANSWERS-a measure of how large the standard
deviation is relative to the mean.
Distribution Shape - ANSWERS-is measured by skewness. If the shape of the data
is skewed to the left, the skewness is negative; if to the right then skewness is
positive; and if the data is symmetric, then skewness is zero.
Z-Score - ANSWERS-z-Scores use the mean and standard deviation in its
calculation. The z-Score yields a standardized value and is the number of standard
deviations from the mean.
Chebyshev's Theorem - ANSWERS-Data values must be within z standard
deviations of the mean (z > 1).
Outlier - ANSWERS-z-score greater than 3
lower limit: 𝑄𝑄1−1.5(𝐼𝐼𝑄𝑄𝐼𝐼)
upper limit: 𝑄𝑄3 + 1.5(𝐼𝐼𝑄𝑄𝐼𝐼)
,Covariance - ANSWERS-is a descriptive measure of the linear association between
two variables.
Dataset - ANSWERS-all the data collected for a particular analysis.
Element - ANSWERS-the entity on which data is collected.
Observation - ANSWERS-the variables associated with an individual element.
Variable - ANSWERS-a characteristic of interest of an element.
Categorical Data - ANSWERS-use numeric or ordinal values of measurement of
categories.
Cross-Sectional Data - ANSWERS-data collected at a similar point in time.
Time Series - ANSWERS-data collected over several time periods.
Panel - ANSWERS-combination of cross-sectional and time series data.
Population - ANSWERS-is the set of all data/variables of a statistical analysis.
, Sample - ANSWERS-subset of the population.
Frequency Formula - ANSWERS-=countif(highlight column, select cell)
Percent Frequency - ANSWERS-=cell/sum(cell range)
Descriptive Analytics - ANSWERS-which describe what has happened in the past.
Predictive Analytics - ANSWERS-uses statistical models from past data to predict
the future forecasting or access the impact of one variable on another inference.
Prescriptive Analytics - ANSWERS-uses models seeking to find a best optimal
solution. Often these are some type of optimization model.
Veracity - ANSWERS-the reliability of the data generated.
Data Mining - ANSWERS-Focuses on extracting predictive information from big
data.
Big Data - ANSWERS-Volume
Velocity
Variety
Veracity