Straighterline MAT150 Business Statistics Graded Exam 4 (New Version August 2024)
We are a team of experts offering course/class attendance (including final proctored exams!!) for all
Straighterline, Online ATI, HESI, NCLEX, Portage Learning, Sophia, Nursing, Business etc courses.
We also write essays, discussion posts, research papers and school assignments. Should you need any
of these services, Contact us via email: or WhatsApp: +1 (540) 753-5914.
Guaranteed Passing!
Question 1
Correct
5.00 points out of 5.00
Flag question
Question text
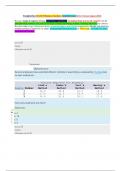
Several employees have submitted different methods of assembling a subassembly. Sample data
for each method are:
Minutes Required for Assembly
Lind's Szabo's Carl's Manley's
Sample Number Method Method Method Method
1 16.6 22.4 31.4 18.4
2 17.0 21.5 33.4 19.6
3 16.9 22.6 30.1 17.6
How many treatments are there?
Select one:
a. 4
b. 12
c. 0
d. 3
Question 2
Correct
5.00 points out of 5.00
, Flag question
Question text
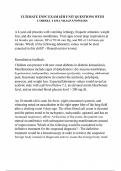
The annual dividend rates for a random sample of 16 companies in three different industries, utilities,
banking, and insurance, were recorded. The ANOVA comparing the mean annual dividend rate
among three industries rejected the null hypothesis that the dividend rates were equal.
The mean square error (MSE) was 3.36. The following table summarized the results:
Utilities Banking Insurance
Number Sampled 5 5 6
Mean Annual Dividend Rate 11.62 15.4 17.4
Based on the comparison between the mean annual dividend rate for companies in banking and
utilities, the 95% confidence interval shows an interval of 1.28 to 6.28 for the difference. This result
indicates that ________.
Select one:
a. the annual dividend rate in the banking industry is significantly more than the annual dividend rate
in the utilities industry
b. there is no significant difference between the two rates
c. the interval contains a difference of 5.00
d. the annual dividend rate in the banking industry is significantly less than the annual dividend rate
in the utilities industry
Question 3
Incorrect
0.00 points out of 5.00
Flag question
Question text
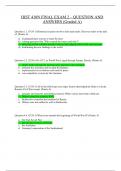
Given the following ANOVA table for three treatments each with six observations:
Source Sum of Squares df Mean square
Treatment 1,116
Error 1,068
We are a team of experts offering course/class attendance (including final proctored exams!!) for all
Straighterline, Online ATI, HESI, NCLEX, Portage Learning, Sophia, Nursing, Business etc courses.
We also write essays, discussion posts, research papers and school assignments. Should you need any
of these services, Contact us via email: or WhatsApp: +1 (540) 753-5914.
Guaranteed Passing!
Question 1
Correct
5.00 points out of 5.00
Flag question
Question text
Several employees have submitted different methods of assembling a subassembly. Sample data
for each method are:
Minutes Required for Assembly
Lind's Szabo's Carl's Manley's
Sample Number Method Method Method Method
1 16.6 22.4 31.4 18.4
2 17.0 21.5 33.4 19.6
3 16.9 22.6 30.1 17.6
How many treatments are there?
Select one:
a. 4
b. 12
c. 0
d. 3
Question 2
Correct
5.00 points out of 5.00
, Flag question
Question text
The annual dividend rates for a random sample of 16 companies in three different industries, utilities,
banking, and insurance, were recorded. The ANOVA comparing the mean annual dividend rate
among three industries rejected the null hypothesis that the dividend rates were equal.
The mean square error (MSE) was 3.36. The following table summarized the results:
Utilities Banking Insurance
Number Sampled 5 5 6
Mean Annual Dividend Rate 11.62 15.4 17.4
Based on the comparison between the mean annual dividend rate for companies in banking and
utilities, the 95% confidence interval shows an interval of 1.28 to 6.28 for the difference. This result
indicates that ________.
Select one:
a. the annual dividend rate in the banking industry is significantly more than the annual dividend rate
in the utilities industry
b. there is no significant difference between the two rates
c. the interval contains a difference of 5.00
d. the annual dividend rate in the banking industry is significantly less than the annual dividend rate
in the utilities industry
Question 3
Incorrect
0.00 points out of 5.00
Flag question
Question text
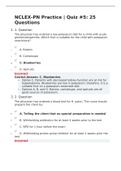
Given the following ANOVA table for three treatments each with six observations:
Source Sum of Squares df Mean square
Treatment 1,116
Error 1,068