Jace Beard
Summer II 2024 Analytics for Managers (BUS 511)
7/15/24
Learning Task Submission 1
1. Corporation A: Mean stock price: $51.26
Standard deviation: $10.06
Corporation B: Mean stock price: $50.21
Standard deviation: $8.96
Analysis:
Corporation A had a higher average stock price ($51.26) than Corporation B ($50.21) during the
timeframe.
Higher Dispersion: Corporation A's stock price had a higher standard deviation ($10.06) than
Corporation B ($8.96).
Corporation A had a higher average stock price, but its prices were more erratic than
Corporation B's.
2. (a) Mean and Median Revenues
Firm A: Mean revenue: $79,231 million
Median revenue: $77,349M
Firm B: Mean revenue: $52,754M
Median revenue: $50,208M
Firm A outperformed Firm B in average revenue.
Standard Deviation and Variance
Firm A: Variance (s2s^2s2): 106,175,080
Standard deviation: 10,304
Firm B: Variance (s2s^2s2): 56,414,506.
The standard deviation is 7,511.
Conclusion: Firm A had higher revenue standard deviation than Firm B.
Coefficient of Variation (Relative Dispersion)
Firm A: CV = 0.130.
Firm B: CV = 0.142.
Conclusion: The coefficient of variation showed larger revenue dispersion for Firm B.
In summary, Firm A had larger average revenues.
Firm A had more distributed absolute revenues.
Firm B's income were more dispersed.
, 3. Standard Deviation and Mean
Rent monthly:
Mean: $1,222.93
The standard deviation is $424.80, and the mean square footage is 1,286.03 sq. ft.
Standard deviation: 645.81 sq.ft.
Variation Coefficient | Relative Dispersion
Rent monthly:
The coefficient of variation (CV) is 0.347. The square footage is:
CV: 0.502
Conclusion:
Given its higher coefficient of variation (0.502 vs. 0.347), square footage is more dispersed than
monthly rent. This means that square footage is more variable than monthly rent.
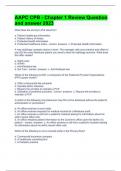
4. Overall Trend: Amazon (AMZN): Amazon's stock rose significantly from 2016 to 2019. From
$587 in January 2016 to $2,000 in August 2018, the price rises. There is a drop around October
2018, however the trend is rising.
Google (GOOG): Google's stock has been rising, albeit less than Amazon. From $742.95 in
January 2016 to $1,337 in December 2019, the price grows. Variations occur, but the trend is
increasing.
Amazon (AMZN) has a significant price increase trajectory, rising from $587 to $1,847.84.
Over the same period, Google (GOOG) had a slight growth from $742.95 to $1,337.02, despite
also appreciating.
Conclusion: Amazon (AMZN) appreciated more than Google (GOOG) from 2016 to 2019.
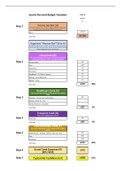
5. India's population has consistently increased from 1960 to 2017. The population rose from
449.48 million in 1960 to 1339.18 million in 2017.
China's population has steadily increased from 667.07 million in 1960 to 1386.40 million in
2017. The early 1960s see a minor drop, but the trend is up.
Population growth (1977-2017):
In 1977, India had a population of around 650.49 million. By 2017, it reached 1339.18 million, up
688.69 million.
In 1977, China had a population of around 943.46 million. By 2017, it reached 1386.40 million,
up 442.94 million.
Conclusion: India has grown faster than China over the past 40 years (1977–2017). India had a
larger absolute population gain throughout this time.
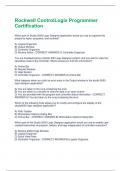
6.The link is positive, therefore math scores increase writing scores.
Summer II 2024 Analytics for Managers (BUS 511)
7/15/24
Learning Task Submission 1
1. Corporation A: Mean stock price: $51.26
Standard deviation: $10.06
Corporation B: Mean stock price: $50.21
Standard deviation: $8.96
Analysis:
Corporation A had a higher average stock price ($51.26) than Corporation B ($50.21) during the
timeframe.
Higher Dispersion: Corporation A's stock price had a higher standard deviation ($10.06) than
Corporation B ($8.96).
Corporation A had a higher average stock price, but its prices were more erratic than
Corporation B's.
2. (a) Mean and Median Revenues
Firm A: Mean revenue: $79,231 million
Median revenue: $77,349M
Firm B: Mean revenue: $52,754M
Median revenue: $50,208M
Firm A outperformed Firm B in average revenue.
Standard Deviation and Variance
Firm A: Variance (s2s^2s2): 106,175,080
Standard deviation: 10,304
Firm B: Variance (s2s^2s2): 56,414,506.
The standard deviation is 7,511.
Conclusion: Firm A had higher revenue standard deviation than Firm B.
Coefficient of Variation (Relative Dispersion)
Firm A: CV = 0.130.
Firm B: CV = 0.142.
Conclusion: The coefficient of variation showed larger revenue dispersion for Firm B.
In summary, Firm A had larger average revenues.
Firm A had more distributed absolute revenues.
Firm B's income were more dispersed.
, 3. Standard Deviation and Mean
Rent monthly:
Mean: $1,222.93
The standard deviation is $424.80, and the mean square footage is 1,286.03 sq. ft.
Standard deviation: 645.81 sq.ft.
Variation Coefficient | Relative Dispersion
Rent monthly:
The coefficient of variation (CV) is 0.347. The square footage is:
CV: 0.502
Conclusion:
Given its higher coefficient of variation (0.502 vs. 0.347), square footage is more dispersed than
monthly rent. This means that square footage is more variable than monthly rent.
4. Overall Trend: Amazon (AMZN): Amazon's stock rose significantly from 2016 to 2019. From
$587 in January 2016 to $2,000 in August 2018, the price rises. There is a drop around October
2018, however the trend is rising.
Google (GOOG): Google's stock has been rising, albeit less than Amazon. From $742.95 in
January 2016 to $1,337 in December 2019, the price grows. Variations occur, but the trend is
increasing.
Amazon (AMZN) has a significant price increase trajectory, rising from $587 to $1,847.84.
Over the same period, Google (GOOG) had a slight growth from $742.95 to $1,337.02, despite
also appreciating.
Conclusion: Amazon (AMZN) appreciated more than Google (GOOG) from 2016 to 2019.
5. India's population has consistently increased from 1960 to 2017. The population rose from
449.48 million in 1960 to 1339.18 million in 2017.
China's population has steadily increased from 667.07 million in 1960 to 1386.40 million in
2017. The early 1960s see a minor drop, but the trend is up.
Population growth (1977-2017):
In 1977, India had a population of around 650.49 million. By 2017, it reached 1339.18 million, up
688.69 million.
In 1977, China had a population of around 943.46 million. By 2017, it reached 1386.40 million,
up 442.94 million.
Conclusion: India has grown faster than China over the past 40 years (1977–2017). India had a
larger absolute population gain throughout this time.
6.The link is positive, therefore math scores increase writing scores.