
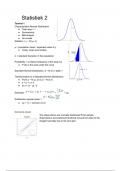
Statistiek 2
Tutorial 1
Characteristics Normal Distribution
● Total area = 1
● Symmetrical
● Bell-shaped
● Uni-model
Notation = y ~ N (μ, σ)
μ = population mean / expected value of y
● mode, mean and median
σ = standard deviation in the population
Probability = a relative frequency in the long-run
● P (A) is the area under the curve
Standard Normal Distribution: Z ~ N (0,1) table 1
Transformation to a Standard Normal Distribution:
● From y ~ N (μ, σ) to Z ~ N (0,1)
● y=μ+zxσ
● or z = (y - μ) / σ
Estimator = = μy
Distribution sample mean =
● σy / √n = standard error
Normal Q-Q plot
The observations are normally distributed if the sample
observations are positioned randomly around but close to the
straight normality line in the Q-Q plot.
,Central Limit Theorem
● For large n, the distribution of the sample mean can be approximated by:
○
○
Population characteristics
● μy = mean in population for variable y
● σy = standard deviation in population for variable y
Estimator
● = mean in sample for variable y
● s = sample standard deviation for variable y
Tutorial 2
● A wider confidence interval captures more data
● Larger critical values correspond to wider intervals of the distribution
● An increase in confidence level results in an increase in the margin of error
sy = sample standard deviation for variable y
sy/ √n = standard error of the mean
Accuracy and precision of an estimator
Estimator (formula)
, Confidence interval = estimator +/- error margin
● A coefficient 1-a reflects a degree of trust: 0.95 means that the procedure with which
a confidence interval is constructed leads to 95% correct statements (such that this
interval contains μy).
○ Meaning that a statement that CI contains μy is 95% of the time correct
○ Or the probability that the CI contains the unknown parameter μy is 0.95
● This procedure occasionally yields an interval where the population parameter μ
does not lie in the confidence interval.
Empirical rule =
● Right-tail p = 0.025 (a/2)
Limits confidence interval
Unknown σ
● Estimate σ by using the sample standard deviation s, the square root of the sample
variances
● The population standard deviation of the mean
is therefore estimated by
Standard error =
Confidence interval for μ with σ known/ unknown
● Assumption: based on random sample of size n from N(μ, σ) population, with
observations y
Tutorial 1
Characteristics Normal Distribution
● Total area = 1
● Symmetrical
● Bell-shaped
● Uni-model
Notation = y ~ N (μ, σ)
μ = population mean / expected value of y
● mode, mean and median
σ = standard deviation in the population
Probability = a relative frequency in the long-run
● P (A) is the area under the curve
Standard Normal Distribution: Z ~ N (0,1) table 1
Transformation to a Standard Normal Distribution:
● From y ~ N (μ, σ) to Z ~ N (0,1)
● y=μ+zxσ
● or z = (y - μ) / σ
Estimator = = μy
Distribution sample mean =
● σy / √n = standard error
Normal Q-Q plot
The observations are normally distributed if the sample
observations are positioned randomly around but close to the
straight normality line in the Q-Q plot.
,Central Limit Theorem
● For large n, the distribution of the sample mean can be approximated by:
○
○
Population characteristics
● μy = mean in population for variable y
● σy = standard deviation in population for variable y
Estimator
● = mean in sample for variable y
● s = sample standard deviation for variable y
Tutorial 2
● A wider confidence interval captures more data
● Larger critical values correspond to wider intervals of the distribution
● An increase in confidence level results in an increase in the margin of error
sy = sample standard deviation for variable y
sy/ √n = standard error of the mean
Accuracy and precision of an estimator
Estimator (formula)
, Confidence interval = estimator +/- error margin
● A coefficient 1-a reflects a degree of trust: 0.95 means that the procedure with which
a confidence interval is constructed leads to 95% correct statements (such that this
interval contains μy).
○ Meaning that a statement that CI contains μy is 95% of the time correct
○ Or the probability that the CI contains the unknown parameter μy is 0.95
● This procedure occasionally yields an interval where the population parameter μ
does not lie in the confidence interval.
Empirical rule =
● Right-tail p = 0.025 (a/2)
Limits confidence interval
Unknown σ
● Estimate σ by using the sample standard deviation s, the square root of the sample
variances
● The population standard deviation of the mean
is therefore estimated by
Standard error =
Confidence interval for μ with σ known/ unknown
● Assumption: based on random sample of size n from N(μ, σ) population, with
observations y


