

APPENDIX B: STATISTICAL METHODS
Related Questions
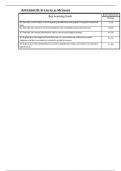
Key Learning Goals
Multiple
B.1 Describe several ways to use frequency distributions and graphs to organize numerical 1-14
Choice
data.
B.2 Describe the measures of central tendency and variability discussed in the text. 15-40
B.3 Describe the normal distribution and its use in psychological testing. 41-54
B.4 Explain how the magnitude and direction of a correlation are reflected in scatter 55-76
diagrams and how correlation is related to predictive power.
B.5 Explain how the null hypothesis is used in hypothesis testing, and relate it to statistical 77-89
significance.
,Appendix B Statistical Methods
MULTIPLE CHOICE
1. The use of mathematics to organize, summarize and interpret numerical data is known as
a. statistical significance.
b. standard deviation.
c. statistics.
d. variability.
ANS: C REF: p. A-7 OBJ: B.1 KEY: Factual
2. Before you construct a histogram you need to
a. calculate an inferential statistic.
b. calculate a correlation.
c. create a frequency distribution.
d. create a series of percentile ranks.
ANS: C REF: p. A-7 OBJ: B.1 KEY: Applied
3. Toshi has collected data for her research. She wants to create an orderly arrangement of scores that would
indicate the frequency of each score; she would be MOST likely to use a
a. scatterplot.
b. frequency distribution.
c. histogram.
d. frequency polygon.
ANS: B REF: p. A-7 OBJ: B.1 KEY: Applied
,4. Dr. Trane wants to create a line figure to present her data that would indicate the frequency of each score.
Dr. Trane will be MOST likely to use a
a. scatterplot.
b. frequency distribution.
c. histogram.
d. frequency polygon.
ANS: D REF: p. A-7 OBJ: B.1 KEY: Conceptual
5. In both bar graphs and frequency polygons, the horizontal axis is typically used to indicate
a. all the possible scores in a data set.
b. the frequency of each score in a data set.
c. the average scores for the entire data set.
d. the strength of the correlation among the scores in a data set.
ANS: A REF: p. A-7 OBJ: B.1 KEY: Factual
6. Your psychology professor wants to organize and summarize the scores on the first psychology test; which
type of statistics is your professor MOST likely to use?
a. descriptive statistics
b. inferential statistics
c. correlational statistics
d. significant statistics
ANS: A REF: p. A-7 OBJ: B.1 KEY: Conceptual
7. Researchers use statistics to do all of the following EXCEPT
a. to interpret numerical data.
, b. to collect numerical data.
c. to summarize numerical data.
d. to organize numerical data.
ANS: B REF: p. A-7 OBJ: B.1 KEY: Factual
8. A table that uses an organized arrangement to indicate how frequently each score or group of scores
occurs in a set of data is a
a. frequency polygon.
b. histogram.
c. frequency distribution.
d. frequency table.
ANS: C REF: p. A-7 OBJ: B.1 KEY: Factual
9. Techniques to graphically represent the frequency of scores in a set of data include
a. histograms and frequency polygons.
b. frequency distributions and frequency polygons.
c. frequency distributions and scatter diagrams.
d. histograms and scatter diagrams.
ANS: A REF: p. A-7 OBJ: B.1 KEY: Factual
10. A histogram is a
a. graph that represents a symmetrical or bell-shaped curve.
b. bar graph that presents data from a frequency distribution.
c. line figure that presents data from a frequency distribution.
d. graph in which paired scores for each subject are plotted as single points.
Related Questions
Key Learning Goals
Multiple
B.1 Describe several ways to use frequency distributions and graphs to organize numerical 1-14
Choice
data.
B.2 Describe the measures of central tendency and variability discussed in the text. 15-40
B.3 Describe the normal distribution and its use in psychological testing. 41-54
B.4 Explain how the magnitude and direction of a correlation are reflected in scatter 55-76
diagrams and how correlation is related to predictive power.
B.5 Explain how the null hypothesis is used in hypothesis testing, and relate it to statistical 77-89
significance.
,Appendix B Statistical Methods
MULTIPLE CHOICE
1. The use of mathematics to organize, summarize and interpret numerical data is known as
a. statistical significance.
b. standard deviation.
c. statistics.
d. variability.
ANS: C REF: p. A-7 OBJ: B.1 KEY: Factual
2. Before you construct a histogram you need to
a. calculate an inferential statistic.
b. calculate a correlation.
c. create a frequency distribution.
d. create a series of percentile ranks.
ANS: C REF: p. A-7 OBJ: B.1 KEY: Applied
3. Toshi has collected data for her research. She wants to create an orderly arrangement of scores that would
indicate the frequency of each score; she would be MOST likely to use a
a. scatterplot.
b. frequency distribution.
c. histogram.
d. frequency polygon.
ANS: B REF: p. A-7 OBJ: B.1 KEY: Applied
,4. Dr. Trane wants to create a line figure to present her data that would indicate the frequency of each score.
Dr. Trane will be MOST likely to use a
a. scatterplot.
b. frequency distribution.
c. histogram.
d. frequency polygon.
ANS: D REF: p. A-7 OBJ: B.1 KEY: Conceptual
5. In both bar graphs and frequency polygons, the horizontal axis is typically used to indicate
a. all the possible scores in a data set.
b. the frequency of each score in a data set.
c. the average scores for the entire data set.
d. the strength of the correlation among the scores in a data set.
ANS: A REF: p. A-7 OBJ: B.1 KEY: Factual
6. Your psychology professor wants to organize and summarize the scores on the first psychology test; which
type of statistics is your professor MOST likely to use?
a. descriptive statistics
b. inferential statistics
c. correlational statistics
d. significant statistics
ANS: A REF: p. A-7 OBJ: B.1 KEY: Conceptual
7. Researchers use statistics to do all of the following EXCEPT
a. to interpret numerical data.
, b. to collect numerical data.
c. to summarize numerical data.
d. to organize numerical data.
ANS: B REF: p. A-7 OBJ: B.1 KEY: Factual
8. A table that uses an organized arrangement to indicate how frequently each score or group of scores
occurs in a set of data is a
a. frequency polygon.
b. histogram.
c. frequency distribution.
d. frequency table.
ANS: C REF: p. A-7 OBJ: B.1 KEY: Factual
9. Techniques to graphically represent the frequency of scores in a set of data include
a. histograms and frequency polygons.
b. frequency distributions and frequency polygons.
c. frequency distributions and scatter diagrams.
d. histograms and scatter diagrams.
ANS: A REF: p. A-7 OBJ: B.1 KEY: Factual
10. A histogram is a
a. graph that represents a symmetrical or bell-shaped curve.
b. bar graph that presents data from a frequency distribution.
c. line figure that presents data from a frequency distribution.
d. graph in which paired scores for each subject are plotted as single points.


