

Written by students who passed Immediately available after payment Read online or as PDF Wrong document? Swap it for free 4.6 TrustPilot
logo-home
Document preview thumbnail
Preview 1 out of 15 pages
Exam (elaborations)

MIP2602 Assignment 3 (ANSWERS) 2024 - DISTINCTION GUARANTEED

Document preview thumbnail
Preview 1 out of 15 pages

Well-structured MIP2602 Assignment 3 (ANSWERS) 2024 - DISTINCTION GUARANTEED. (DETAILED ANSWERS - DISTINCTION GUARANTEED!)..... Question 1 Conduct a survey based on one of the topics below and draft a research report. You are required to collect, organise, and analyse the data and summarise your findings. The topics are as follows: • The age of the Grade 6 (Intermediate Phase) learners • Home language of intermediate teachers Follow the steps below: Step 1: Collecting and organising data 1. Formulate a title for the research project based on the topic you have chosen. (2) 2. Write down the main research question that will guide your investigation. (2) 3. What will be the source(s) of data for each of the two topics? (2) 4. State the population of your study. (1) 5. How does the sample of the study differ from the population of the study? (2) 6. Assuming you were to collect data from each of the two topics, what type of data collection instrument would you use? (2) 7. For each of the two topics, explain the nature of data that will be collected. In your explanation state whether you will obtain qualitative or quantitative data. Further state whether you will obtain categorical data or numerical data. If the data is numeric, state whether it is discrete or continuous. (5) 8. For each of the two topics, state the scale of measurement for the random variable you are investigating. (2) 9. For each of the two topics, write down the question(s) that you would have included in the instrument of your choice to help you get the information (data) necessary to answer the main research question. (4) 10. Gather data from a sample of 20–25 respondents using the instrument you designed. Attach one of the completed instruments to your solution. (5) 11. Construct a frequency table with a tally mark column to record the data in question 10. (8) 12. Make predictions about the data that you collected and arranged or sorted in question 11. (2) [37] 4 Step 2: Representing data 13. Which graph best represents the data that you sorted or organised in question 11? Explain your answer. (3) 14. Use Microsoft Excel to draw the graph that best represents the data you sorted in question 11. (5) 15. Write down two questions that will assist you in interpreting the graph that you drew in question 14. (4) [12] Step 3: Analysing, interpreting, and reporting data – choosing valid descriptive statistical measures. 16. What measure of central tendency (central tendencies) will be most appropriate for analysing the data you have collected? Explain your answer. (3) 17. What is the average (mean, median or mode) of the data that you arranged or sorted in question 11? (2) 18. Based on your answer to question 7, which topic can be analysed with a measure of dispersion, and which topic cannot be analysed with a measure of dispersion, and why? (4) 19. With reference to the graph in your answer to question 14 and the average in your answer to question 17, draw the conclusions about the data that you arranged or sorted in question 11. (2) [11] __________________________________________________________________________ MIP2602/102/0/2024 5 QUESTION 2 2.1 A survey was conducted regarding colour of eyes of Grade 5 learners at a school, separately for boys and girls. The results are shown in the table below: Table 1: Eye colours Colour Boys Girls Hazel 9 12 Blue 10 10 Black 16 13 Green 8 18 Brown 7 5 2.1.1 Use Microsoft Excel to draw a double graph. Copy the graph as it appears on your screen onto your script. (8) 2.1.2 Design (ask) two questions that will help Grade 6 learners interpret the data displayed in table 1 and the graph you drew for question 2.1.1. 2.1.2.1 ____________________________________________. (1) 2.1.2.2 ____________________________________________. (1) 2.2 Grade 9 learners' favourite sports are as follows: Netball Rugby Cricket Hockey Other 11 22 12 17 3 2.2.1 Use Microsoft Excel to draw a pie chart. Copy the graph as it appears on your screen onto your script. (6) 2.2.2 If you were to draw a pie chart manually, how would you establish the size of each section of the pie chart? Demonstrate each segment in degrees. (4)

Content preview

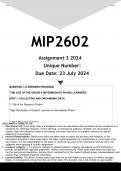
MIP2602
Assignment 3 2024
Unique Number:
Due Date: 23 July 2024

QUESTION 1 (2 ANSWERS PROVIDED)

"THE AGE OF THE GRADE 6 (INTERMEDIATE PHASE) LEARNERS".

STEP 1: COLLECTING AND ORGANISING DATA

1. Title of the Research Project:

"Age Distribution of Grade 6 Learners in Intermediate Phase"


2. Main Research Question:
DISCLAIMER & TERMS OF USE
1. Educational Aid: These study notes are designed to serve as educational aids and should not be considered as a
substitute for individual research, critical thinking, or professional guidance. Students are encouraged to
conduct their own extensive research and consult with their instructors or academic advisors for specific
assignment requirements.
2. Personal Responsibility: While every effort has been made to ensure the accuracy and reliability of the
information provided in these study notes, the seller cannot guarantee the completeness or correctness of all
the content. It is the responsibility of the buyer to verify the accuracy of the information and use their own
judgment when applying it to their assignments.
3. Academic Integrity: It is crucial for students to uphold academic integrity and adhere to their institution's
policies and guidelines regarding plagiarism, citation, and referencing. These study notes should be used as a
tool for learning and inspiration, but any direct reproduction of the content without proper acknowledgment and
citation may constitute academic misconduct.
4. Limited Liability: The seller of these study notes shall not be held liable for any direct or indirect damages,
losses, or consequences arising from the use of the notes. This includes, but is not limited to, poor grades,
academic penalties, or any other negative outcomes resulting from the application or misuse of the information
provided.
]


Connected book
 image
Kakoma Luneta Teaching Mathematics
Publisher: 2018 ISBN: 9780190417390 Edition: Unknown

Document information

Uploaded on
June 23, 2024
Number of pages
15
Written in
2023/2024
Type
Exam (elaborations)
Contains
Questions & answers
$4.83

Wrong document? Swap it for free Within 14 days of purchase and before downloading, you can choose a different document. You can simply spend the amount again.
Written by students who passed
Immediately available after payment
Read online or as PDF

Seller avatar
Reputation scores are based on the amount of documents a seller has sold for a fee and the reviews they have received for those documents. There are three levels: Bronze, Silver and Gold. The better the reputation, the more your can rely on the quality of the sellers work.
Edge
4.2
(1354)
Sold
10912
Followers
4256
Items
3181
Last sold
4 hours ago

Reviews from verified buyers

2 year ago

I think it's helpful


Why students choose Stuvia

Created by fellow students, verified by reviews

Quality you can trust: written by students who passed their tests and reviewed by others who've used these notes.

Didn't get what you expected? Choose another document

No worries! You can instantly pick a different document that better fits what you're looking for.

Pay as you like, start learning right away

No subscription, no commitments. Pay the way you're used to via credit card and download your PDF document instantly.

Student with book image

“Bought, downloaded, and aced it. It really can be that simple.”

Alisha Student

Working on your references?

Create accurate citations in APA, MLA and Harvard with our free citation generator.

Working on your references?

Frequently asked questions

