30821207 | Freya Patten
Practical Work Portfolio- Week 4 (NOx Levels in relation to Roads and Population)
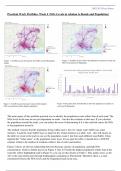
Figure 1: ArcGIS Layout showing the 1km buffer around Hampshire Figure 2: ArcGIS Layout to show the population in relation to roads and
Roads NOx Concentration in Hampshire
Figure 3: ArcGIS Layout showing 5 roads with the highest Figure 4: Data taken from ArcGIS table to show the population in relation to
NOx concentration and the highest population each road in Hampshire
The main aspect of this portfolio practical was to identify the population count within 1km of each road. The
NOx levels in the area are not just dependent on roads – but also the residents in that area. If you calculate
the population around the roads, you can reduce the error of determining if it is the road that causes the NOx
or the population around it.
The method I used to find the population living within each 1 km of a ‘larger road’ buffer was zonal
statistics. I used the raster buffer layer as input for the ‘Zonal statistics as a table’ tool – this will ensure on
the table we create at the end we can see the population count 1 km from each different road buffer. I then
inputted the ‘Value raster’ as the population raster layer. If you open the table, it should show a COUNT
column, which is the number of residents within 1 km of each road number.
Figure 2 shows an obvious relationship between the large clusters of population, and high NOx
concentration, which is further proven in Figure 4. The A27 holds the highest population within 1km of the
road (the yellow highlighted road in Figure 3); you can see this clearly in Table 1. This makes sense, as the
A27 is the road which goes through Southampton continuing to Portsmouth. Therefore, there is a clear
correlation between the NOx levels and the frequented roads in the area.
Practical Work Portfolio- Week 4 (NOx Levels in relation to Roads and Population)
Figure 1: ArcGIS Layout showing the 1km buffer around Hampshire Figure 2: ArcGIS Layout to show the population in relation to roads and
Roads NOx Concentration in Hampshire
Figure 3: ArcGIS Layout showing 5 roads with the highest Figure 4: Data taken from ArcGIS table to show the population in relation to
NOx concentration and the highest population each road in Hampshire
The main aspect of this portfolio practical was to identify the population count within 1km of each road. The
NOx levels in the area are not just dependent on roads – but also the residents in that area. If you calculate
the population around the roads, you can reduce the error of determining if it is the road that causes the NOx
or the population around it.
The method I used to find the population living within each 1 km of a ‘larger road’ buffer was zonal
statistics. I used the raster buffer layer as input for the ‘Zonal statistics as a table’ tool – this will ensure on
the table we create at the end we can see the population count 1 km from each different road buffer. I then
inputted the ‘Value raster’ as the population raster layer. If you open the table, it should show a COUNT
column, which is the number of residents within 1 km of each road number.
Figure 2 shows an obvious relationship between the large clusters of population, and high NOx
concentration, which is further proven in Figure 4. The A27 holds the highest population within 1km of the
road (the yellow highlighted road in Figure 3); you can see this clearly in Table 1. This makes sense, as the
A27 is the road which goes through Southampton continuing to Portsmouth. Therefore, there is a clear
correlation between the NOx levels and the frequented roads in the area.