lOMoAR cPSD| 22896205 lOMoAR cPSD| 22896205
Test Bank and Solutions For Microeconomics 4th
Canadian Edition By Paul Krugman
Indicate the answer choice that best completes the statement or answers the question.
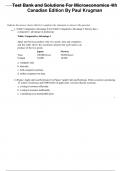
1. (Table: Comparative Advantage I) Use Table: Comparative Advantage I. Norway has a
comparative advantage in producing:
Table: Comparative Advantage I
Japan and Norway produce only two goods, tuna and computers,
and this table shows the maximum amount that each nation can
produce of the two goods.
Japan Norway
Tuna 100,000 boxes 50,000 boxes
Comput 10,000 10,000
a. computers only.
b. tuna only.
c. both computers and tuna.
d. neither computers nor tuna.
2. (Figure: Apple cider and Soybeans) Use Figure: Apple Cider and Soybeans. If this economy is producing
12 tonnes of soybeans and 9,000 bottles of apple cider, we know that the economy:
a. is using its resources efficiently.
b. is using its resources inefficiently.
c. is producing at an unattainable point.
1
, lOMoAR cPSD| 22896205
3. Which of the following is sold in the factor market?
a. club sandwiches
b. tractors
c. nail polish removal
d. prescription medications
4. (Figure: Apple Cider and Soybeans) Use Figure: Apple Cider and Soybeans. If this economy is
producing at point A, we know the economy is:
a. using its resources efficiently.
b. using its resources inefficiently.
c. producing at an unattainable point.
d. trading with another country.
5. Marius and Jennifer are going to sell cupcakes and muffins at their third annual fundraiser bake sale. In
one day, Marius can make 40 cupcakes or 20 muffins, and Jennifer can make 15 cupcakes or 15
muffins. Based on this information, has the comparative
advantage in cupcakes, and has the comparative
advantage in muffins.
a. Marius; Jennifer
b. Marius; Marius
c. Jennifer; Marius
d. Jennifer; Jennifer
, lOMoAR cPSD| 22896205
6. Which of the following is NOT a common practice of economists when constructing models?
a. simulating the workings of the economy on a computer
b. utilizing physical constructs, such as those of architects, to represent economic relationships
c. creating abstract representations of the economy through simplifying assumptions
d. relying heavily on plain language expositions of their ideas rather than mathematical equations
and graphs
7. Which of the following is sold in the product market?
a. farmland
b. factory workers
c. computers
d. human capital
8. (Scenario: Linear Production Possibility Frontier) Use Scenario: Linear Production Possibility Frontier.
If Smallville’s labour resource decrease by 40 hours, the opportunity cost of producing pants:
Scenario: Linear Production Possibility Frontier
Smallville has a linear production possibility frontier, and it produces pants
and cowboy hats with 80 hours of labour. The table shows the number
of hours of labour necessary to produce one pair of pants or one cowboy
Number of hours of Number of hours of labour to
labour to produce one produce one cowboy hat
4 2
a. increases.
b. decreases.
c. does not change.
d. may or may not change, depending upon the number of cowboy hats it wishes to produce.
, lOMoAR cPSD| 22896205
9. (Table: Production Possibilities Schedule II) Use Table: Production Possibilities Schedule II. If the
economy is producing at point D, the opportunity cost of producing at E is cell phones per
period.
Table: Production Possibilities Schedule II
Alternatives A B C D E
Computers 0 1 2 3 4
Cell phones 20 18 14 8 0
a. 1
b. 6
c. 8
d. 14
10. After Hurricane Katrina, there was extensive damage to much of the infrastructure of the southern
United States. How would Katrina have affected the production possibility frontier?
a. an outward shift
b. an inward shift
c. a movement along the production possibility frontier
d. a movement to a point inside the production possibility frontier
11. Suppose Ontario produces only steel and barley, with fixed amounts of land, labour, and capital resources.
Which scenario BEST sets the stage for economic growth?
a. The unemployment rate in Ontario rises from 5% to 6%.
b. The province experiences a devastating drought.
c. The percentage of Ontario residents with a university degree rises from 15% to 23%.
d. Canada imports more and more low-cost steel from the United States.
Test Bank and Solutions For Microeconomics 4th
Canadian Edition By Paul Krugman
Indicate the answer choice that best completes the statement or answers the question.
1. (Table: Comparative Advantage I) Use Table: Comparative Advantage I. Norway has a
comparative advantage in producing:
Table: Comparative Advantage I
Japan and Norway produce only two goods, tuna and computers,
and this table shows the maximum amount that each nation can
produce of the two goods.
Japan Norway
Tuna 100,000 boxes 50,000 boxes
Comput 10,000 10,000
a. computers only.
b. tuna only.
c. both computers and tuna.
d. neither computers nor tuna.
2. (Figure: Apple cider and Soybeans) Use Figure: Apple Cider and Soybeans. If this economy is producing
12 tonnes of soybeans and 9,000 bottles of apple cider, we know that the economy:
a. is using its resources efficiently.
b. is using its resources inefficiently.
c. is producing at an unattainable point.
1
, lOMoAR cPSD| 22896205
3. Which of the following is sold in the factor market?
a. club sandwiches
b. tractors
c. nail polish removal
d. prescription medications
4. (Figure: Apple Cider and Soybeans) Use Figure: Apple Cider and Soybeans. If this economy is
producing at point A, we know the economy is:
a. using its resources efficiently.
b. using its resources inefficiently.
c. producing at an unattainable point.
d. trading with another country.
5. Marius and Jennifer are going to sell cupcakes and muffins at their third annual fundraiser bake sale. In
one day, Marius can make 40 cupcakes or 20 muffins, and Jennifer can make 15 cupcakes or 15
muffins. Based on this information, has the comparative
advantage in cupcakes, and has the comparative
advantage in muffins.
a. Marius; Jennifer
b. Marius; Marius
c. Jennifer; Marius
d. Jennifer; Jennifer
, lOMoAR cPSD| 22896205
6. Which of the following is NOT a common practice of economists when constructing models?
a. simulating the workings of the economy on a computer
b. utilizing physical constructs, such as those of architects, to represent economic relationships
c. creating abstract representations of the economy through simplifying assumptions
d. relying heavily on plain language expositions of their ideas rather than mathematical equations
and graphs
7. Which of the following is sold in the product market?
a. farmland
b. factory workers
c. computers
d. human capital
8. (Scenario: Linear Production Possibility Frontier) Use Scenario: Linear Production Possibility Frontier.
If Smallville’s labour resource decrease by 40 hours, the opportunity cost of producing pants:
Scenario: Linear Production Possibility Frontier
Smallville has a linear production possibility frontier, and it produces pants
and cowboy hats with 80 hours of labour. The table shows the number
of hours of labour necessary to produce one pair of pants or one cowboy
Number of hours of Number of hours of labour to
labour to produce one produce one cowboy hat
4 2
a. increases.
b. decreases.
c. does not change.
d. may or may not change, depending upon the number of cowboy hats it wishes to produce.
, lOMoAR cPSD| 22896205
9. (Table: Production Possibilities Schedule II) Use Table: Production Possibilities Schedule II. If the
economy is producing at point D, the opportunity cost of producing at E is cell phones per
period.
Table: Production Possibilities Schedule II
Alternatives A B C D E
Computers 0 1 2 3 4
Cell phones 20 18 14 8 0
a. 1
b. 6
c. 8
d. 14
10. After Hurricane Katrina, there was extensive damage to much of the infrastructure of the southern
United States. How would Katrina have affected the production possibility frontier?
a. an outward shift
b. an inward shift
c. a movement along the production possibility frontier
d. a movement to a point inside the production possibility frontier
11. Suppose Ontario produces only steel and barley, with fixed amounts of land, labour, and capital resources.
Which scenario BEST sets the stage for economic growth?
a. The unemployment rate in Ontario rises from 5% to 6%.
b. The province experiences a devastating drought.
c. The percentage of Ontario residents with a university degree rises from 15% to 23%.
d. Canada imports more and more low-cost steel from the United States.