Management Research Methods 1
Week 1: Introduction to statistics
Data:
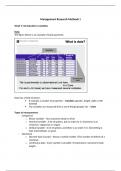
The figure below is an example of bank payments.
Data has a fixed structure:
It contains a number of properties – Variables (gender, length, right or left-
handed)
The variables are measured from a set of things/people/ etc – Units
Types of measurement:
- Categorical
o Binary variable - Two outcomes (dead or alive)
o Nominal variable - A lot of options, but no order for it. (Someone is an
omnivore, vegetarian or vegan).
o Ordinal variable - A lot of options, and there is an order in it. (Something is
bad, intermediate, or good.
- Numerical
o Discrete data (counts) - Always a whole number. (The number of defects of a
machine).
o Continuous data - Every number is possible. (Temperature, someone's body
length.
,Variables can be converted to a lower level of measurement. For example:
Body length: < 160cm = small
Body length: > 160cm and < 180 cm = normal
Body length: > 180 cm = tall
Converting variables into a lower level of measurement will cause a loss of information,
which is not reversible.
Level of measurement:
- Binary variables will contain the least information - continuous variables will contain
the most information.
- Numerical data contains more information than categorical data. As a result, you
need larger samples for data with less information.
Data collection:
In quantitative research, you need to motivate and document the way you collect data:
Is the sample representative? – Do the data reflect the characteristics of the entire
population?
o For example, the group of students in this college room is not representative
of asking for what the outcome of the elections will be because we are a very
limited group. All students, all young, all from the same city, etc.
o Measure outside temperature for 5 days in October, this conclusion is not
valid for July.
Is the data valid? – Do the data reflect what they should reflect? Can they be used to
answer the research question?
o Data should be checked for errors and mistakes.
o Did everybody measuring know the procedure?
o Were there other problems?
, Is there a measurement error? – The discrepancy between the actual value we are
trying to measure, and the number we use
o For example, you want to measure something in milliseconds but your device
is only able to measure in seconds.
o For example, You (in reality) weigh 80 kg. According to your bathroom scale,
you weigh 83 kg. The measurement error is 3 kg.
Example of a bias:
In the Second World War, the Dutch army used flight planes. Because a lot of planes were
crashing, they wanted to reinforce the planes in the weak spots. So they measured the
amount of holes on different spots of planes that came back.
Looking at the picture above you would suggest reinforcing part B of the planes, this part got
hit the most. But this thought is called a bias. Because you are only using data from planes
that came back. The biggest issue is with the planes that didn’t come back. Looking at the
data from that perspective, it would be better to reinforce part D of the plane. The planes
that DID come back, were not shot that much in part D. This leads to the conclusion the
planes that crashed, were shot in part D.
Measurement error:
There are two types of measurement errors:
Systematic measurement error – the difference between the average measurement
result and the true value
o People always overestimate there self when they need to grade their driving
performance.
o Clocks on mobile phones are regularly synchronized with online time servers.
Random measurement error – Unsystematic deviations due to imprecision of the
measurement. (Bigger issue then systematic errors)
o For ice skating at the Winter Olympics, multiple time measurement systems
are used to decide who is the winner. (You will click too late because you do it
after hearing the sound)
o Weight measurements on a weighing scale fluctuate because it's nearly
impossible to stand on the scale very same way each time.