STK110 Preparation sheet: TUT3 memo 2023
1. Suppose we are interested in investigating the difference between weeknight hours slept for two
generations. A random sample of 40 Y-ers (Generation Y’ers (Millennials): Born: 1980 – 1995)
and 20 Z-ers (Generation Z’ers: Born: 1996 →) were asked the number of hours they sleep on a
randomly chosen weeknight (minutes were converted to a fraction of an hour). The results are
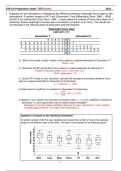
summarised in the following back-to-back stem-and-leaf diagram:
Weeknight hours slept
Leaf unit = 0.1
Generation Y Generation Z
9 8 8 6 6 5 6
9 8 8 8 8 8 6 6 6 5 5 5 6 6 7
9 8 8 6 3 3 2 2 2 0 0 0 7 0 0 4 6 8 8 9
9 9 9 8 8 6 6 6 5 0 0 8 0 0 5 7 7 7 8 8 8
9 2
a) What is the modal number (mode) of hours slept on a typical weeknight for Generation Y?
Mode = 6.8
b) Determine the 60th percentile of hours slept on a typical weeknight for Generation Y.
Position of 60th percentile =(40+1)×60/100=24.6
24.6th observation: 7.3
c) Using STAT-mode on your calculator, calculate the average and standard deviation hours
slept on a typical weeknight for Generation Z (2 decimals).
𝑥̅ = 7.88 and 𝑠 = 0.94
d) Determine the coefficient of variation for Generation Z (2 decimals).
0.94
𝑐𝑣𝑧 = ∗ 100 = 11.93%
7.88
e) Based on your answer from Question d and given that 𝑐𝑣𝑦 =13.52% (coefficient variation for
Generation Y), which generation has the lowest relative variability?
Generation Z has the lowest variability relative to its mean. Generation Y has a relative
variability approximately 1.5% higher than Generation Z.
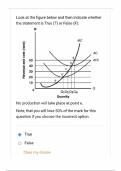
Question 2 is based on the following information:
A random sample of 80 first year students were asked the number of hours they typically
sleep on the different days of the week. The data is summarised in the following figure:
Hours slept
1
1. Suppose we are interested in investigating the difference between weeknight hours slept for two
generations. A random sample of 40 Y-ers (Generation Y’ers (Millennials): Born: 1980 – 1995)
and 20 Z-ers (Generation Z’ers: Born: 1996 →) were asked the number of hours they sleep on a
randomly chosen weeknight (minutes were converted to a fraction of an hour). The results are
summarised in the following back-to-back stem-and-leaf diagram:
Weeknight hours slept
Leaf unit = 0.1
Generation Y Generation Z
9 8 8 6 6 5 6
9 8 8 8 8 8 6 6 6 5 5 5 6 6 7
9 8 8 6 3 3 2 2 2 0 0 0 7 0 0 4 6 8 8 9
9 9 9 8 8 6 6 6 5 0 0 8 0 0 5 7 7 7 8 8 8
9 2
a) What is the modal number (mode) of hours slept on a typical weeknight for Generation Y?
Mode = 6.8
b) Determine the 60th percentile of hours slept on a typical weeknight for Generation Y.
Position of 60th percentile =(40+1)×60/100=24.6
24.6th observation: 7.3
c) Using STAT-mode on your calculator, calculate the average and standard deviation hours
slept on a typical weeknight for Generation Z (2 decimals).
𝑥̅ = 7.88 and 𝑠 = 0.94
d) Determine the coefficient of variation for Generation Z (2 decimals).
0.94
𝑐𝑣𝑧 = ∗ 100 = 11.93%
7.88
e) Based on your answer from Question d and given that 𝑐𝑣𝑦 =13.52% (coefficient variation for
Generation Y), which generation has the lowest relative variability?
Generation Z has the lowest variability relative to its mean. Generation Y has a relative
variability approximately 1.5% higher than Generation Z.
Question 2 is based on the following information:
A random sample of 80 first year students were asked the number of hours they typically
sleep on the different days of the week. The data is summarised in the following figure:
Hours slept
1