
3. Trend analysis
Horizontal common size analysis/Trend analysis – In horizontal common size analysis, each
account’s value is expressed as a percentage of a designated base year’s account values. This
allows an analyst to see how each item has changed in relationship to the changes in other
items over a period of time. Horizontal analysis is also referred to as trend analysis.
Example:
Prepare a horizontal common size Statement Of Profit Or Loss account for Google Inc for
years 2008 – 2011 and discuss changes in these accounts: Gross profit, Operating Income, net
income
Google Inc. Income Statement (figures in $) 2008 2009 2010 2011
Revenues 21796.00 23651.00 29,321.00 37,905.00
Cost of Goods Sold 8622.00 8844.00 10,417.00 13,188.00
GROSS PROFIT 13174.00 14807.00 18,904.00 24,717.00
Selling General & Admin Expenses, Total 3749.00 3652.00 4,761.00 7,313.00
R&D Expenses 2793.00 2843.00 3,762.00 5,162.00
EBIT 6632.00 8312.00 10,381.00 12,242.00
Interest and Investment Income 222.00 (28.00) 230.00 440.00
EBT 6854.00 8284.00 10,611.00 12,682.00
Income Tax Expense 1626.00 1861.00 2,291.00 2,589.00
NET INCOME 4227.00 6520.00 8,505.00 9,737.00
Solution:
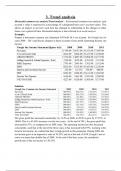
Google Inc. Common size Income Statement 2008 2009 2010 2011
Revenues 100.00% 108.51% 134.52% 173.91%
Cost of Goods Sold 100.00% 102.57% 120.82% 152.96%
GROSS PROFIT 100.00% 112.40% 143.49% 187.62%
Selling General & Admin Expenses, Total 100.00% 97.41% 126.99% 195.07%
R&D Expenses 100.00% 101.79% 134.69% 184.82%
EBIT 100.00% 125.33% 156.53% 184.59%
Interest and Investment Income 100.00% -12.61% 103.60% 198.20%
EBT 100.00% 120.86% 154.81% 185.03%
Income Tax Expense 100.00% 114.45% 140.90% 159.23%
NET INCOME 100.00% 154.25% 201.21% 230.35%
The gross profit has increased consistently, by 12.4% in 2009, in 2010; it grew by 27.67%, to
18904. This is a 43.49% increase over the two years. At the end of 2011, the gross profit has
increased by 87%, as compared to its 2008 value. The operating income has also increased
consistently, such that at the end of the three years, it has increased by84.59%. Looking at the
trend in net income, its evident that there is high growth in this parameter. During 2009, the
net income grew at an impressive ratio of 54.25% and as at the end of 2010, Google’s net in-
come was more than double that of 2008. At the end of the three years, the cumulative
growth rate of the net income is 130.35%


