
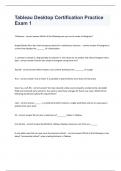
Tableau Desktop Certification Practice Exam 1 correctly answered rated A+
Tableau Desktop Certification Practice Exam 11 Measure - correct answer Which of the following can you use to create a Histogram? shape//(looks like a bar chart but group values for a continuous measure. - correct answer A histogram is a chart that displays the _______ of a distribution 1. connect to sample 2. drag quantity to columns 3. click show me on toolbar and select histogram chart type - correct answer How do you create a histogram using show me? Top left - correct answer Most viewers scan content starting at the ________ of a page True - correct answer True or False: It is possible to add a field to more than one hierarchy Save it as a .tds file - correct answer You have cleaned a data source properly, created some calculated fields and renamed some columns. You want to save these changes for future use cases. Which of the following would best satisfy this requirement? .twm - correct answer ______ is a bookmark which contains a single worksheet and are an easy way to quickly share your work. 32 - correct answer We can join a maximum of ________ tables in Tableau Line (chart) - correct answer By definition, Tableau displays measures over time as a ______ It only adds rows that are new since the previous refresh. - correct answer Which of the following is true about "Incremental refresh" when creating Extracts in Tableau 1. replaces all the contents in the extract 2. only adds rows that are new since the previous refresh. - correct answer When refreshing the data, you have the option to either do a full refresh, which ___ ____ ____ ____ or you can do a incremental refresh, which ___ ____ ___ ___ ____. True - correct answer True or False: The highlighting action can be disabled for the entire workbook Text, Image, Web Page, Extension - correct answer Which of the following are valid objects when creating a dashboard in Tableau? No - correct answer Is it possible to add both a Dashboard and a Worksheet at the same time to a Story Point in Tableau? Creates a live connection to the data - correct answer BY default, what does Tableau do when you connect to a data source. live connection - correct answer By default, when you connect a data source to Tableau, Tableau will create a _________ to the data. Context Filter - correct answer Our use case states that we need to create a set showing the Bottom 10 products by Profit in each Region. Which of the following filter types should you apply on Region? Histogram - correct answer Which of the following chart type makes use of 'binned' data? November (All answers except November are examples of Date Values (continuous in nature) - correct answer Which of the following is an example of a Date Part? Q4 2017 / November / September 2020 / March 2019 No // SUM is an aggregate function. // A table calculation is a transformation you apply to the values in a visualization. - correct answer Is SUM a table calculation? True // You can show trend lines in a visualization to highlight trends in your data. - correct answer True or False: Trend lines can only be used with numeric or date fields
Document information
- Uploaded on
- October 21, 2023
- Number of pages
- 6
- Written in
- 2023/2024
- Type
- Exam (elaborations)
- Contains
- Questions & answers


