As
OCR
Oxford Cambridge and RSA
Wednesday 24 May 2023 – Afternoon
AS Level Physics A
H156/02 Depth in physics
Time allowed: 1 hours 30 minutes
You must have:
the Data, Formulae and Relationships Booklet
You can use:
a scientific or graphical calculator
a ruler (cm/mm)
Please write clearly in black ink. Do not write in the barcodes.
Centre number Candidate number
First name(s)
Last name
INSTRUCTIONS
• Use black ink. You can use an HB pencil, but only for graphs and diagrams.
• Write your answer to each question in the space provided. If you need extra
space use the lined pages at the end of this booklet. The question numbers
must be clearly shown.
• Answer all the questions.
• Where appropriate, your answer should be supported with working.
Marks might be given for using a correct method, even if your answer is
wrong.
INFORMATION
• The total mark for this paper is 70.
• The marks for each question are shown in brackets [ ].
• Quality of extended response will be assessed in questions marked with an
asterisk (*).
• This document has 24 pages.
ADVICE
• Read each question carefully before you start your answer.
,© OCR 2023
OCR is an exempt
[601/4742/8] DC
Charity Turn over
(DE/SG) 328408/4
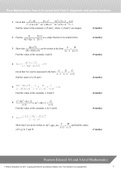
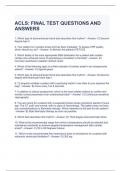
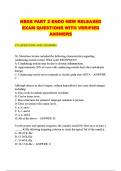
, 1 The brakes of a car of mass 1200 kg are being tested on a track. The driver sees a
hazard and applies the brakes.
The graph shows the variation of the velocity v of the car with time t from when
the driver sees the hazard to when the car stops.
20
v / m s–1
15
10
5
0
0.0 1.0 1.5 2.0 2.5 3.0 3.5
t/s
0.5
(a) (i) Calculate the acceleration a of the car while the brakes are applied.
a =...........................................m s–2 [1]
(ii) Calculate the average braking force F while the brakes are applied.
F =................................................N [1]
, (iii) Calculate the total stopping distance d of the car.
d =................................................m [2]
(iv) Calculate the work W done by the brakes to stop the car.
W =.................................................J [2]
(b) The same driver in the same car repeats the test at half the initial velocity. The
braking force is constant.
On the graph, draw the variation of velocity of the car from the time the driver
sees the hazard to the time the car stops. [2]
(c) Explain how your graph in (b) would change if:
(i) the driver was tired
..................................................................................................................................
.................
....................................................................................................................................
.......... [1]
(ii) the surface of the track was more resistive.
..................................................................................................................................
.................
....................................................................................................................................
.......... [1]
OCR
Oxford Cambridge and RSA
Wednesday 24 May 2023 – Afternoon
AS Level Physics A
H156/02 Depth in physics
Time allowed: 1 hours 30 minutes
You must have:
the Data, Formulae and Relationships Booklet
You can use:
a scientific or graphical calculator
a ruler (cm/mm)
Please write clearly in black ink. Do not write in the barcodes.
Centre number Candidate number
First name(s)
Last name
INSTRUCTIONS
• Use black ink. You can use an HB pencil, but only for graphs and diagrams.
• Write your answer to each question in the space provided. If you need extra
space use the lined pages at the end of this booklet. The question numbers
must be clearly shown.
• Answer all the questions.
• Where appropriate, your answer should be supported with working.
Marks might be given for using a correct method, even if your answer is
wrong.
INFORMATION
• The total mark for this paper is 70.
• The marks for each question are shown in brackets [ ].
• Quality of extended response will be assessed in questions marked with an
asterisk (*).
• This document has 24 pages.
ADVICE
• Read each question carefully before you start your answer.
,© OCR 2023
OCR is an exempt
[601/4742/8] DC
Charity Turn over
(DE/SG) 328408/4
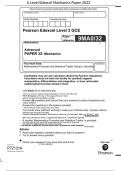
, 1 The brakes of a car of mass 1200 kg are being tested on a track. The driver sees a
hazard and applies the brakes.
The graph shows the variation of the velocity v of the car with time t from when
the driver sees the hazard to when the car stops.
20
v / m s–1
15
10
5
0
0.0 1.0 1.5 2.0 2.5 3.0 3.5
t/s
0.5
(a) (i) Calculate the acceleration a of the car while the brakes are applied.
a =...........................................m s–2 [1]
(ii) Calculate the average braking force F while the brakes are applied.
F =................................................N [1]
, (iii) Calculate the total stopping distance d of the car.
d =................................................m [2]
(iv) Calculate the work W done by the brakes to stop the car.
W =.................................................J [2]
(b) The same driver in the same car repeats the test at half the initial velocity. The
braking force is constant.
On the graph, draw the variation of velocity of the car from the time the driver
sees the hazard to the time the car stops. [2]
(c) Explain how your graph in (b) would change if:
(i) the driver was tired
..................................................................................................................................
.................
....................................................................................................................................
.......... [1]
(ii) the surface of the track was more resistive.
..................................................................................................................................
.................
....................................................................................................................................
.......... [1]