
NR 340 BASIC DYSRHYTHMIA INTERPRETATION EXAM 2
STUDY GUIDE (CRITICAL CARE)
Basic Dysrhythmia Interpretation & Mgmt-Ch 7
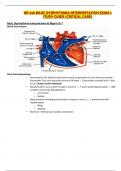
Blood Flow Review
Basic Electrophysiology
• Automaticity-The ability for the heart muscle to generate it's own electrical activity o
Pacemaker Cells arise naturally from the SA Node o Electrolytes involved are K+, Na+,
& Ca+ Cardiac Action Potentials
• Depolarization-occurs when charge is more (+) o P wave=atrial depolarization o QRS
complex=ventricular depolarization
o contraction
o Systole
• Repolarization-recharging period when charge is more (-) o T wave=ventricular
repolarization
o filling
o Diastole
• Electrical + Mechanical=Cardiac Contraction
, • Action Potential Curve o See Below-Sodium, Potassium, & Calcium flow in & out of
the cell at different times allowing for charge changes and contraction of heart muscle
tissue. o 4 Phases
Early Repolarization
• sodium channels close
Phase 2-Plateau Phase
• potassium leaves cell
Phase 3-Rapid Repolarization
• calcium channels close
• potassium returns into cell quickly Phase 4-Resting Phase (polarized state)
• active transport through the Na-K pump begins restoring K to inside the cell & sodium
to the outside of the cell
• cell membranes become impermeable to sodium Potassium may move in & out of
the cell
Intrinsic Rates of Conduction Pathway
• SA Node
o natural pacemaker o
60-100 bpm
• AV Node
, o takes over as pacemaker if SA node can't do
the job o 40-60 bpm
• Purkinje Fibers o last resort to pace heart if both SA & AV nodes fail
o 20-40 bpm Cardiac Monitoring
• 12 lead ECG
o only 10 electrodes used to monitor, but gives
12 overall electrical pictures
4 limb leads
6 trunk leads o shows change or damage to heart muscle
ischemia, infarct, enlarged cardiac chambers, electrolyte imbalances or drug
toxicity
Calculating Heart Rate from a 6 Second Strip
• Graph Paper
o Vertical boxes measure voltage or amplitude
o Horizontal boxes measure time (in
seconds)
1 small box=0.04 seconds
1 large box=0.20 seconds
5 large boxes=1 second
• a six-second strip will be 30 large boxes
• To calculate rate on a 6 second strip, count R-to-R and multiply by 10 Cardiac
Waveforms & Determining Rhythm
• P Wave
• atrial depolarization 0.04-0.10 seconds in duration Are they present?
are they regularly occurring?
is there a P for each QRS?
are the P waves smooth, rounded, & upright?
do all P waves look similar?
• QRS Complex
• ventricular depolarization
• 0.06-0.10 seconds in duration
is the complex > 0.12 seconds (wide)?
• can indicate ventricular origin
, is the complex < 0.12 seconds (narrow)?
• most likely supraventricular in origin (SA/AV nodes)
do the complexes have a similar appearance across the tracing?
QT Interval
• 0.38-0.42 seconds
• begins at the QRS Complex to the end of the T wave
• varies with heart rate Pathological Q waves
• 0.04 seconds in width & more than 1/4 R wave amplitude
• indication of MI or myocardial tissue death
• ST Segment
• Elevation
myocardial injury or hyperkalemia
• STEMI
looks like a
tombstone Depression
myocardial
ischemia or digoxin use
• T Wave
• ventricular repolarization
• follows QRS Complex U Wave
• can sometimes bee seen after the T wave
• can be normal or indicate hypokalemia PR Interval
• 0.12-0.20 seconds in duration
is the interval > 0.20 seconds?
is the interval < 0.12 seconds?
is the interval constant across the tracing?
Cardiac Dysrhythmias
• Normal Sinus
• Rate 60-100
• Rhythm regular
• P waves before QRS & upright
• PR interval 0.12-0.20 seconds
• QRS complexes <0.12 seconds & look alike Sinus tachycardia Causes
stress, exercise, fever, anemia, hypoxemia,
CHF, pain Effects on body
faster rate decreases CO
• S&S
pounding heart, dizziness, anxiety, weak pulses
decreased BP, UO
• Treatment
treat underlying cause
give O2
STUDY GUIDE (CRITICAL CARE)
Basic Dysrhythmia Interpretation & Mgmt-Ch 7
Blood Flow Review
Basic Electrophysiology
• Automaticity-The ability for the heart muscle to generate it's own electrical activity o
Pacemaker Cells arise naturally from the SA Node o Electrolytes involved are K+, Na+,
& Ca+ Cardiac Action Potentials
• Depolarization-occurs when charge is more (+) o P wave=atrial depolarization o QRS
complex=ventricular depolarization
o contraction
o Systole
• Repolarization-recharging period when charge is more (-) o T wave=ventricular
repolarization
o filling
o Diastole
• Electrical + Mechanical=Cardiac Contraction
, • Action Potential Curve o See Below-Sodium, Potassium, & Calcium flow in & out of
the cell at different times allowing for charge changes and contraction of heart muscle
tissue. o 4 Phases
Early Repolarization
• sodium channels close
Phase 2-Plateau Phase
• potassium leaves cell
Phase 3-Rapid Repolarization
• calcium channels close
• potassium returns into cell quickly Phase 4-Resting Phase (polarized state)
• active transport through the Na-K pump begins restoring K to inside the cell & sodium
to the outside of the cell
• cell membranes become impermeable to sodium Potassium may move in & out of
the cell
Intrinsic Rates of Conduction Pathway
• SA Node
o natural pacemaker o
60-100 bpm
• AV Node
, o takes over as pacemaker if SA node can't do
the job o 40-60 bpm
• Purkinje Fibers o last resort to pace heart if both SA & AV nodes fail
o 20-40 bpm Cardiac Monitoring
• 12 lead ECG
o only 10 electrodes used to monitor, but gives
12 overall electrical pictures
4 limb leads
6 trunk leads o shows change or damage to heart muscle
ischemia, infarct, enlarged cardiac chambers, electrolyte imbalances or drug
toxicity
Calculating Heart Rate from a 6 Second Strip
• Graph Paper
o Vertical boxes measure voltage or amplitude
o Horizontal boxes measure time (in
seconds)
1 small box=0.04 seconds
1 large box=0.20 seconds
5 large boxes=1 second
• a six-second strip will be 30 large boxes
• To calculate rate on a 6 second strip, count R-to-R and multiply by 10 Cardiac
Waveforms & Determining Rhythm
• P Wave
• atrial depolarization 0.04-0.10 seconds in duration Are they present?
are they regularly occurring?
is there a P for each QRS?
are the P waves smooth, rounded, & upright?
do all P waves look similar?
• QRS Complex
• ventricular depolarization
• 0.06-0.10 seconds in duration
is the complex > 0.12 seconds (wide)?
• can indicate ventricular origin
, is the complex < 0.12 seconds (narrow)?
• most likely supraventricular in origin (SA/AV nodes)
do the complexes have a similar appearance across the tracing?
QT Interval
• 0.38-0.42 seconds
• begins at the QRS Complex to the end of the T wave
• varies with heart rate Pathological Q waves
• 0.04 seconds in width & more than 1/4 R wave amplitude
• indication of MI or myocardial tissue death
• ST Segment
• Elevation
myocardial injury or hyperkalemia
• STEMI
looks like a
tombstone Depression
myocardial
ischemia or digoxin use
• T Wave
• ventricular repolarization
• follows QRS Complex U Wave
• can sometimes bee seen after the T wave
• can be normal or indicate hypokalemia PR Interval
• 0.12-0.20 seconds in duration
is the interval > 0.20 seconds?
is the interval < 0.12 seconds?
is the interval constant across the tracing?
Cardiac Dysrhythmias
• Normal Sinus
• Rate 60-100
• Rhythm regular
• P waves before QRS & upright
• PR interval 0.12-0.20 seconds
• QRS complexes <0.12 seconds & look alike Sinus tachycardia Causes
stress, exercise, fever, anemia, hypoxemia,
CHF, pain Effects on body
faster rate decreases CO
• S&S
pounding heart, dizziness, anxiety, weak pulses
decreased BP, UO
• Treatment
treat underlying cause
give O2


