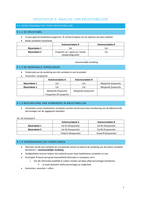
HOOFDSTUK 9: ANALYSE VAN KRUISTABELLEN
9.1 GEGEVENSANALYSE VOOR KRUISTABELLEN
9.1.1 DE KRUISTABEL
Fouten gebruik kwalitatieve gegevens verkeerd begrip van de opbouw van deze tabellen
Beide variabelen kwalitatief
Kolomvariabele A Kolomvariabele B
Rijvariabele 1 Cel Cel
Rijvariabele 2 Proportie cel = getal cel / totale Cel
steekproefgrootte
Gezamenlijke verdeling
9.1.2 DE MARGINALE VERDELINGEN
Onderzoek van de verdeling van één variabele in een kruistabel
Procenten > proporties
Kolomvariabele A Kolomvariabele B
Rijvariabele 1 Cel Cel Marginale frequentie
Rijvariabele 2 Cel Cel Marginale frequentie
Marginale frequentie Marginale frequentie
Frequentie OF proportie
9.1.3 BESCHRIJVING VAN VERBANDEN IN KRUISTABELLEN
Verbanden tussen kwalitatieve variabelen worden beschreven door berekening van de bijbehorende
percentages van de opgegeven aantallen.
Vb. Cel A1/totaal A
Kolomvariabele A Kolomvariabele B
Rijvariabele 1 Cel A1 (frequentie) Cel B1 (frequentie)
Rijvariabele 2 Cel A2 (frequentie) Cel B2 (frequentie)
Totaal A (frequentie) Totaal B (frequentie)
9.1.4 VOORWAARDELIJKE VERDELINGEN
Wanneer we de ene variabele als voorwaarde nemen en daarna de verdeling van de andere variabele
berekenen = voorwaardelijke verdeling
Staafgrafieken kunnen helpen het verband tussen twee kwalitatieve variabelen te zien
Kruistabel bevat een grote hoeveelheid informatie in compacte vorm.
o Om die informatie duidelijk te maken moeten we bijna altijd percentages berekenen.
Je moet besluiten welke percentages je nodig hebt
Kolommen: woorden > cijfers
1
9.1 GEGEVENSANALYSE VOOR KRUISTABELLEN
9.1.1 DE KRUISTABEL
Fouten gebruik kwalitatieve gegevens verkeerd begrip van de opbouw van deze tabellen
Beide variabelen kwalitatief
Kolomvariabele A Kolomvariabele B
Rijvariabele 1 Cel Cel
Rijvariabele 2 Proportie cel = getal cel / totale Cel
steekproefgrootte
Gezamenlijke verdeling
9.1.2 DE MARGINALE VERDELINGEN
Onderzoek van de verdeling van één variabele in een kruistabel
Procenten > proporties
Kolomvariabele A Kolomvariabele B
Rijvariabele 1 Cel Cel Marginale frequentie
Rijvariabele 2 Cel Cel Marginale frequentie
Marginale frequentie Marginale frequentie
Frequentie OF proportie
9.1.3 BESCHRIJVING VAN VERBANDEN IN KRUISTABELLEN
Verbanden tussen kwalitatieve variabelen worden beschreven door berekening van de bijbehorende
percentages van de opgegeven aantallen.
Vb. Cel A1/totaal A
Kolomvariabele A Kolomvariabele B
Rijvariabele 1 Cel A1 (frequentie) Cel B1 (frequentie)
Rijvariabele 2 Cel A2 (frequentie) Cel B2 (frequentie)
Totaal A (frequentie) Totaal B (frequentie)
9.1.4 VOORWAARDELIJKE VERDELINGEN
Wanneer we de ene variabele als voorwaarde nemen en daarna de verdeling van de andere variabele
berekenen = voorwaardelijke verdeling
Staafgrafieken kunnen helpen het verband tussen twee kwalitatieve variabelen te zien
Kruistabel bevat een grote hoeveelheid informatie in compacte vorm.
o Om die informatie duidelijk te maken moeten we bijna altijd percentages berekenen.
Je moet besluiten welke percentages je nodig hebt
Kolommen: woorden > cijfers
1