DNSC 4280 Machine Learning Class Notes
8/29: Introduction
8/31: Review - Data Mining
●
Supervised learning: explain relationship between predictor and target
●
Predictor/explanatory variable/covariates = same
●
Model Fitting
○
training/validation
■
Build model that optimizes performance of training data setoverfittink=n
■
Try to have best fit of training data
■
Prevent under/overfitting
■
Use validation to check which model performs the best, then deploy best
model on test data set
■
Use training to train different models
■
No overlapping info between training and validation data
○
underfitting/overfitting
○
Trade off
■
Predictive accuracy vs interpretability
■
Parsimony vs blackbox
●
Assess performance on validation (hold-out) data
●
Problem of overfitting
○
Fit may look good but it doesn’t perform well on other datasets
●
Training - 80, Validation - 20
○
Validation: test different models
■
Compute MSE for each model to compare performance
■
Choose best model
○
Test data: summary
●
Model Complexity
○
Overfitting
■
It’s too flexible around the main points of the data
■
The points in the data though only represent the training dataset not the
validation or the test datasets
■
Improve performance on testing dataset not just training
■
Model is too complicated
■
Variability of model is large, increase testing MSE but decease training
MSE (focus on testing error)
○
Underfitting - not flexible enough to capture relationships
■
MSE would be very large for testing/training
●
Bias Variance Tradeoff
○
Simple model - bias large, variance small
○
Testing MSE is summation of bias and variance
○
If you use complicated model you will not have bias, prediction will be too
uncertain for future, high variance ○
We want flexibility so that bias and variance are properly controlled
Practice from Assignment 1 (I realized these are available on BB)
Exercise 1: Sequences
x3 = (1, 0, -1, -2)
1:(-2)
x4 = c(“Hellow, “ “, “World”. “!”)
X4 = c(x4, paste(x4, collapse = “”)
X4
X5 = c(TRUE, FALSE, NA, FALSE) ; x6
X6 <- c(rep(1:2), 2), rep (1:2, each = 2)); x6
Exercise 2: Matrix
X <- rbind(1:4, x3, matrix(x2, 2, 4, byrow = TRUE)
X
Lists: List()
-
Extract list info - use double bracket, or a $
9/7: HW 1 Overview
●
Girl what is going on i have no idea lol. All i know is that Pedro said that the homework is
rough
●
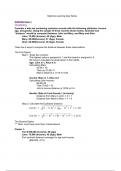
Loops <3
○
(f, lower, upper, tol = 1e-6) to find the root of univariate function F on the interval
(upper,lower)
■
Searching for a root between 1 and 2
○
with the precision tolerance <tol defaulted to be a 10^-6 via bisection which
returns a list consisting of root, f.root (f evaluated at root), iter (# of iterations)
■
How many times it takes to find the root
●
Track whether two points are root or not..?
○
Find whether midpoint is a root of function of x .. = 0
■
F(x)= x^3 -x -1
○
Root between two points that =0
○
F(a+b/2)>0 or <0
○
Function value of root = F(x) (Lol)
■
Root = x
●
Discrete Random Sampling
○
Stratified sampling: identically separated ○
Each level contains same proportion as the entire data set
○
Train a model
●
Probability density function
●
Optimization problems
○
Finding maximum of likelihood typically written in a particular form
○
F(x)=X^2-2x-1
■
Minimize f(x)
9/12: Clustering
●
Clustering is an example of undirected data mining techniques
○
It is used to segment the data, or to find islands of similarity within the data
○
Find islands of similarity
●
Can be useful for marketing segmentation
●
Classification of species
●
Portfolio management
○
You want to know which stocks are similar and which arent
●
Clustering techniques
○
K means clustering
○
Agglomerative clustering
○
Decision trees
○
Neural nets
●
Decide how many clusters we want to have before hand, decide criteria to decide what
clusters are best fitting toward the data
●
Calculate variance of clusters, find overall variance within cluster
●
Want variance to be small to find evidence of similarity
●
Want total variance within clusters to be small
●
Find two cluster such that the summation of the two variances are small
●
Total variance within clusters are small
○
As you increase the number of clusters the total variance decreases (stabilizes)
○
Morse and more clusters, you need to explain underlying common pattern in
cluster, hard to explain/interpret
●
Hierarchical Methods -
most popular method
○
Agglomerative Methods
○
Bottom to top method
○
Begin with N clusters - total number of observations, keep trying to merch
clusters based on the distance between all clusters
■
Therefore reducing number of clusters
○
Do this until one cluster is left
●
Divisive Method
○
Top down method
○
Start with all inclusive cluster but then repeatedly divide all datapoints into
smaller clusters, a cluster for each datapoint
●
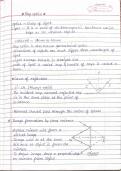
Dendrogram - calculate pairwise distances between clusters
○
Y axis is distances between clusters ○
Want to find clusters to merge, based on their distance
○
21 and 12, 10 and 13
○
Calculate distance between two
■
Distance between 12 to 10
●
12 to 12
●
21 to 10
●
21 to 13
■
D1 as ameasure to
○
Euclidean distance
■
Draw points on XY plane
■
■
If all variables are categorical you cannot use euclidean distance to
calculate
●
Calculate differences
●
A has one difference b has 0 difference, 1+0=1, so distance is 1
○
Scaling
■
The variables contributions to distance function won’t be based on the
size of the units they are measured in
9/14: Clustering
●
Dendrogram: starts out with the number of observations we have then starts to cluster
each observation together based on the distance from each observation
●
Cannot have a nice visual representation with a large dataset, it is computationally
expensive (DRAWBACK OF CLUSTERING)
●
Interpreting the clusters
○
Summarize descriptive statistics of each cluster
○
Find column means to know what kind of words to use to describe cluster
○
Can use cluster to identify outliers
●
Data are from the same population and are independent and normally distributed
●
If you have one big cluster you may want to refine it to be able to find more pattern in
detail
●
Merge two cloisters based on closest distance - single linkage method
○
May end up getting cluster with long shape
8/29: Introduction
8/31: Review - Data Mining
●
Supervised learning: explain relationship between predictor and target
●
Predictor/explanatory variable/covariates = same
●
Model Fitting
○
training/validation
■
Build model that optimizes performance of training data setoverfittink=n
■
Try to have best fit of training data
■
Prevent under/overfitting
■
Use validation to check which model performs the best, then deploy best
model on test data set
■
Use training to train different models
■
No overlapping info between training and validation data
○
underfitting/overfitting
○
Trade off
■
Predictive accuracy vs interpretability
■
Parsimony vs blackbox
●
Assess performance on validation (hold-out) data
●
Problem of overfitting
○
Fit may look good but it doesn’t perform well on other datasets
●
Training - 80, Validation - 20
○
Validation: test different models
■
Compute MSE for each model to compare performance
■
Choose best model
○
Test data: summary
●
Model Complexity
○
Overfitting
■
It’s too flexible around the main points of the data
■
The points in the data though only represent the training dataset not the
validation or the test datasets
■
Improve performance on testing dataset not just training
■
Model is too complicated
■
Variability of model is large, increase testing MSE but decease training
MSE (focus on testing error)
○
Underfitting - not flexible enough to capture relationships
■
MSE would be very large for testing/training
●
Bias Variance Tradeoff
○
Simple model - bias large, variance small
○
Testing MSE is summation of bias and variance
○
If you use complicated model you will not have bias, prediction will be too
uncertain for future, high variance ○
We want flexibility so that bias and variance are properly controlled
Practice from Assignment 1 (I realized these are available on BB)
Exercise 1: Sequences
x3 = (1, 0, -1, -2)
1:(-2)
x4 = c(“Hellow, “ “, “World”. “!”)
X4 = c(x4, paste(x4, collapse = “”)
X4
X5 = c(TRUE, FALSE, NA, FALSE) ; x6
X6 <- c(rep(1:2), 2), rep (1:2, each = 2)); x6
Exercise 2: Matrix
X <- rbind(1:4, x3, matrix(x2, 2, 4, byrow = TRUE)
X
Lists: List()
-
Extract list info - use double bracket, or a $
9/7: HW 1 Overview
●
Girl what is going on i have no idea lol. All i know is that Pedro said that the homework is
rough
●
Loops <3
○
(f, lower, upper, tol = 1e-6) to find the root of univariate function F on the interval
(upper,lower)
■
Searching for a root between 1 and 2
○
with the precision tolerance <tol defaulted to be a 10^-6 via bisection which
returns a list consisting of root, f.root (f evaluated at root), iter (# of iterations)
■
How many times it takes to find the root
●
Track whether two points are root or not..?
○
Find whether midpoint is a root of function of x .. = 0
■
F(x)= x^3 -x -1
○
Root between two points that =0
○
F(a+b/2)>0 or <0
○
Function value of root = F(x) (Lol)
■
Root = x
●
Discrete Random Sampling
○
Stratified sampling: identically separated ○
Each level contains same proportion as the entire data set
○
Train a model
●
Probability density function
●
Optimization problems
○
Finding maximum of likelihood typically written in a particular form
○
F(x)=X^2-2x-1
■
Minimize f(x)
9/12: Clustering
●
Clustering is an example of undirected data mining techniques
○
It is used to segment the data, or to find islands of similarity within the data
○
Find islands of similarity
●
Can be useful for marketing segmentation
●
Classification of species
●
Portfolio management
○
You want to know which stocks are similar and which arent
●
Clustering techniques
○
K means clustering
○
Agglomerative clustering
○
Decision trees
○
Neural nets
●
Decide how many clusters we want to have before hand, decide criteria to decide what
clusters are best fitting toward the data
●
Calculate variance of clusters, find overall variance within cluster
●
Want variance to be small to find evidence of similarity
●
Want total variance within clusters to be small
●
Find two cluster such that the summation of the two variances are small
●
Total variance within clusters are small
○
As you increase the number of clusters the total variance decreases (stabilizes)
○
Morse and more clusters, you need to explain underlying common pattern in
cluster, hard to explain/interpret
●
Hierarchical Methods -
most popular method
○
Agglomerative Methods
○
Bottom to top method
○
Begin with N clusters - total number of observations, keep trying to merch
clusters based on the distance between all clusters
■
Therefore reducing number of clusters
○
Do this until one cluster is left
●
Divisive Method
○
Top down method
○
Start with all inclusive cluster but then repeatedly divide all datapoints into
smaller clusters, a cluster for each datapoint
●
Dendrogram - calculate pairwise distances between clusters
○
Y axis is distances between clusters ○
Want to find clusters to merge, based on their distance
○
21 and 12, 10 and 13
○
Calculate distance between two
■
Distance between 12 to 10
●
12 to 12
●
21 to 10
●
21 to 13
■
D1 as ameasure to
○
Euclidean distance
■
Draw points on XY plane
■
■
If all variables are categorical you cannot use euclidean distance to
calculate
●
Calculate differences
●
A has one difference b has 0 difference, 1+0=1, so distance is 1
○
Scaling
■
The variables contributions to distance function won’t be based on the
size of the units they are measured in
9/14: Clustering
●
Dendrogram: starts out with the number of observations we have then starts to cluster
each observation together based on the distance from each observation
●
Cannot have a nice visual representation with a large dataset, it is computationally
expensive (DRAWBACK OF CLUSTERING)
●
Interpreting the clusters
○
Summarize descriptive statistics of each cluster
○
Find column means to know what kind of words to use to describe cluster
○
Can use cluster to identify outliers
●
Data are from the same population and are independent and normally distributed
●
If you have one big cluster you may want to refine it to be able to find more pattern in
detail
●
Merge two cloisters based on closest distance - single linkage method
○
May end up getting cluster with long shape