Principal component analysis and cluster analysis
Source : Everitt and Hothorn, Handbook of Statistical Analysis using R, Chapman & Hall
Multidimensional data are data where within each individual or each observation unit many
variables have been measured: several (p) variables measured in one observational unit.
- How do the variables relate to each other
- Are there subgroups in the data
- Can we summarize the information in less than p variables
We will discuss two techniques: PCA and cluster analysis. Both are exploratory techniques: they
are made to explore the data. It does not involve hypothesis testing, parameters estimation or
confidence interval and we are also not doing significance testing. The results should not be
over-interpreted.
PCA: redistribute the information from the original variables (p dimension) to an equal number
of p new variables: these are called the principal components.
- Loadings
- Scores
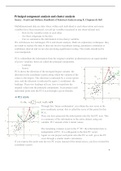
PCA shows the direction of the strongest/largest variants: the
direction in the coordinate system along which the variants of the
values is the largest. This direction is indicated by a vector (green
one), and the direction is indicated by again 2 coordinates: the
loadings. These two loadings tell you how to transform the
original values into the principle components. It can project each
individual point onto the PCA axis through a given formula.
Through this ‘linear combination’ you obtain the new score in the
new coordinate system: this is called the score of this point for this
PCA.
Then you have projected the initial points onto the first PC axis. This
is a summary of the information in the entire dataset using one
variable: PC1 instead of the 2 initial values.
The remaining variance is put in the 2nd PC: the information here is
independent of PC1. It is orthogonal to the first PC vector.
Again we can project each point onto this PC as well: gives the PC
score through a similar matrix calculation.
If you express this point onto the two PC axises instead of the initial axises, you have twisted the
coordinate system.
1
,Principal components analysis (PCA) : the heptathlon dataset.
The dataset heptathlon1988.txt consists of the heptathlon results at the Olympic games in 1988 in
Seoul, South Korea. Participants compete in 7 athletics disciplines (100m hurdles, high jump,
shot, run200m, long jump, javelin, run800m). Athletes conquer points at each discipline and the
participant with most points at the end wins the competition. In 1988, the competition was won
by America’s Jacky Joyner-Kersee. Below are the original results.
Results from all 25 participating athletes is given in the heptathlon1988.txt dataset. In the last
column, the official Olympic score is given.
heptathlon<-read.table("heptathlon1988.txt",header=T)
The running competitions are measured in seconds, while the longjump, highjump, javelin and
shot are in metres. This means that for longjump, javelin and shot, higher values are better,
whereas in the 3 running events (hurdles, 200m and 800m), a lower value s better. Therefore, we
recode the results of the running events so that a high value means a good result across all
events.
heptathlon$hurdles <- max(heptathlon$hurdles) -heptathlon$hurdles
heptathlon$run200m <- max(heptathlon$run200m) -heptathlon$run200m
heptathlon$run800m <- max(heptathlon$run800m) -heptathlon$run800m
names(heptathlon)[8]<-"pointsTotal"
2
, In the following exercise we will explore the structure of the data using principal component
analysis, and compare how the principal component scores relate to the official Olympic scores.
The aim of principal component analysis is to describe variation in a set of correlated variables.
We can calculate all pairwise correlations between the results from the 7 competitions, and
visualize them using a pairs plot (which is nothing more than a matrix of scatterplots). Note that
we leave out the final column with the official Olympic score.
plot(heptathlon[,-8])
round(cor(heptathlon[,-8]),3)
The cor.test represents the strength of the relation between variables! 0 is no relation, +1 is strong
positive correlation, -1 is strong negative correlation.
Most pairs of events are positively correlated, with the notable exception of the javelin throw.
This is a much more technical event, compared to the other power-related competitions. The
pairs plot also identified one outlier – your instructor will tell you why.
This was an athlete from Papouia-New-Guinea (Launa): she has much worse results than all the
other competitors.
The seven competitions are a multi (7-)variate measurement on each individual, with the 7
measurements being correlated. Principal component analysis (PCA) redistributes the
3
Source : Everitt and Hothorn, Handbook of Statistical Analysis using R, Chapman & Hall
Multidimensional data are data where within each individual or each observation unit many
variables have been measured: several (p) variables measured in one observational unit.
- How do the variables relate to each other
- Are there subgroups in the data
- Can we summarize the information in less than p variables
We will discuss two techniques: PCA and cluster analysis. Both are exploratory techniques: they
are made to explore the data. It does not involve hypothesis testing, parameters estimation or
confidence interval and we are also not doing significance testing. The results should not be
over-interpreted.
PCA: redistribute the information from the original variables (p dimension) to an equal number
of p new variables: these are called the principal components.
- Loadings
- Scores
PCA shows the direction of the strongest/largest variants: the
direction in the coordinate system along which the variants of the
values is the largest. This direction is indicated by a vector (green
one), and the direction is indicated by again 2 coordinates: the
loadings. These two loadings tell you how to transform the
original values into the principle components. It can project each
individual point onto the PCA axis through a given formula.
Through this ‘linear combination’ you obtain the new score in the
new coordinate system: this is called the score of this point for this
PCA.
Then you have projected the initial points onto the first PC axis. This
is a summary of the information in the entire dataset using one
variable: PC1 instead of the 2 initial values.
The remaining variance is put in the 2nd PC: the information here is
independent of PC1. It is orthogonal to the first PC vector.
Again we can project each point onto this PC as well: gives the PC
score through a similar matrix calculation.
If you express this point onto the two PC axises instead of the initial axises, you have twisted the
coordinate system.
1
,Principal components analysis (PCA) : the heptathlon dataset.
The dataset heptathlon1988.txt consists of the heptathlon results at the Olympic games in 1988 in
Seoul, South Korea. Participants compete in 7 athletics disciplines (100m hurdles, high jump,
shot, run200m, long jump, javelin, run800m). Athletes conquer points at each discipline and the
participant with most points at the end wins the competition. In 1988, the competition was won
by America’s Jacky Joyner-Kersee. Below are the original results.
Results from all 25 participating athletes is given in the heptathlon1988.txt dataset. In the last
column, the official Olympic score is given.
heptathlon<-read.table("heptathlon1988.txt",header=T)
The running competitions are measured in seconds, while the longjump, highjump, javelin and
shot are in metres. This means that for longjump, javelin and shot, higher values are better,
whereas in the 3 running events (hurdles, 200m and 800m), a lower value s better. Therefore, we
recode the results of the running events so that a high value means a good result across all
events.
heptathlon$hurdles <- max(heptathlon$hurdles) -heptathlon$hurdles
heptathlon$run200m <- max(heptathlon$run200m) -heptathlon$run200m
heptathlon$run800m <- max(heptathlon$run800m) -heptathlon$run800m
names(heptathlon)[8]<-"pointsTotal"
2
, In the following exercise we will explore the structure of the data using principal component
analysis, and compare how the principal component scores relate to the official Olympic scores.
The aim of principal component analysis is to describe variation in a set of correlated variables.
We can calculate all pairwise correlations between the results from the 7 competitions, and
visualize them using a pairs plot (which is nothing more than a matrix of scatterplots). Note that
we leave out the final column with the official Olympic score.
plot(heptathlon[,-8])
round(cor(heptathlon[,-8]),3)
The cor.test represents the strength of the relation between variables! 0 is no relation, +1 is strong
positive correlation, -1 is strong negative correlation.
Most pairs of events are positively correlated, with the notable exception of the javelin throw.
This is a much more technical event, compared to the other power-related competitions. The
pairs plot also identified one outlier – your instructor will tell you why.
This was an athlete from Papouia-New-Guinea (Launa): she has much worse results than all the
other competitors.
The seven competitions are a multi (7-)variate measurement on each individual, with the 7
measurements being correlated. Principal component analysis (PCA) redistributes the
3