

Rana Habib Rahman
Unit 7 – M2
Alex Kamotho
In this assignment I will analyse the importance of accounting data and statistical information to
assess and predict business performance.
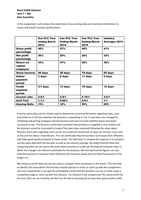
Sun PLC Year Sun PLC Year Sun PLC Year Industry
ending March Ending March Ending March Averages 2015
2013 2014 2015
Gross profit 46% 47% 46% 41%
percentage
Net profit 30% 29% 20% 32%
percentage
Return on 43% 47% 50% 39%
capital
employed
Stock turnover 46 days 58 days 79 days 65 days
Debtor 3 days 8 days 11 days 5 days
payment
period
Credit 5.7 days 13 days 16 days 12 days
payment
period
Current ratio 4.8:1 4.9:1 5.19:1 4.5:1
Acid Test 1.1:1 0.89:1 0.6:1 1:1
Gearing Ratio 15% 18% 29% 20%
Previous years data can be initially used to determine current performance regarding sales, costs
and profits as it tells you whether the business is expanding or not. It may have also changed its
marketing and pricing strategies and the business will want to know whether these have been
successful or not. The business could have innovated new products or targeted a new market and
the business would be interested to know if the sales have improved following the steps taken.
Previous years data regarding costs can be very useful for businesses as they can monitor costs such
as the cost for labour, materials etc. This can eventually help the business to increase their efficiency
and make good quality products at lower prices. The best way to compare the expense is to compare
current years data with the last year as well as the industry average. By using financial ratios and
comparing them we can assess the areas where business is under performing and evaluate ways in
which the changes can influence positively for the business. Monitoring financial figures can also
help the business to maximize their efficiency and minimise waste that can help the business in the
longer run.
Net and gross profit data can also be used to compare other businesses in the sector. This can help
to identify the areas where the business should improve in order to catch up with the competitors
and most importantly it can spot the profitability trends that the business can use in order to get a
competitive edge or catch up with the industry. For instance if we compare Sun Plc’s gross profit for
the year 2015 we can instantly see that Sun Plc did an amazing job to keep their gross profit to 46%
1
Unit 7 – M2
Alex Kamotho
In this assignment I will analyse the importance of accounting data and statistical information to
assess and predict business performance.
Sun PLC Year Sun PLC Year Sun PLC Year Industry
ending March Ending March Ending March Averages 2015
2013 2014 2015
Gross profit 46% 47% 46% 41%
percentage
Net profit 30% 29% 20% 32%
percentage
Return on 43% 47% 50% 39%
capital
employed
Stock turnover 46 days 58 days 79 days 65 days
Debtor 3 days 8 days 11 days 5 days
payment
period
Credit 5.7 days 13 days 16 days 12 days
payment
period
Current ratio 4.8:1 4.9:1 5.19:1 4.5:1
Acid Test 1.1:1 0.89:1 0.6:1 1:1
Gearing Ratio 15% 18% 29% 20%
Previous years data can be initially used to determine current performance regarding sales, costs
and profits as it tells you whether the business is expanding or not. It may have also changed its
marketing and pricing strategies and the business will want to know whether these have been
successful or not. The business could have innovated new products or targeted a new market and
the business would be interested to know if the sales have improved following the steps taken.
Previous years data regarding costs can be very useful for businesses as they can monitor costs such
as the cost for labour, materials etc. This can eventually help the business to increase their efficiency
and make good quality products at lower prices. The best way to compare the expense is to compare
current years data with the last year as well as the industry average. By using financial ratios and
comparing them we can assess the areas where business is under performing and evaluate ways in
which the changes can influence positively for the business. Monitoring financial figures can also
help the business to maximize their efficiency and minimise waste that can help the business in the
longer run.
Net and gross profit data can also be used to compare other businesses in the sector. This can help
to identify the areas where the business should improve in order to catch up with the competitors
and most importantly it can spot the profitability trends that the business can use in order to get a
competitive edge or catch up with the industry. For instance if we compare Sun Plc’s gross profit for
the year 2015 we can instantly see that Sun Plc did an amazing job to keep their gross profit to 46%
1


