

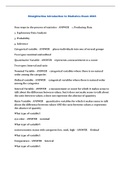
Straighterline Introduction to Statistics Exam 2023 Four steps in the process of statistics - ANSWER 1. Producing Data 2. Exploratory Data Analysis 3. Probability 4. Inference Categorical variable - ANSWER places individuals into one of several groups Two types: nominal and ordinal Quantitative Variable - ANSWER represents a measurement or a count Two types: Interval and ratio Nominal Variable - ANSWER categorical variables where there is no natural order among the categories Ordinal variable - ANSWER categorical variables where there is natural order among the categories Interval Variable - ANSWER a measurement or count for which it makes sense to talk about the difference between values, but it does not make sense to talk about the ratio between values; 0 does not represent the absence of quanitity Ratio Variable - ANSWER quantitative variables for which it makes sense to talk about the difference between values AND the ratio between values; 0 represents the absence of quantity What type of variable?: eye color - ANSWER nominal What type of variable?: socioeconomic status with categories low, med, high - ANSWER Ordinal What type of variable?: Temperature - ANSWER Interval What type of variable?: Income - ANSWER Ratio Visual display and numerical summary for a single categorical variable - ANSWER pie chart or bar chart and category percentages Visual display and numerical summary for a single quantitative variable - ANSWER histogram or stemplot and descriptive statistics Visual display and numerical summary for C->C - ANSWER Two way table and conditional percentages Visual display and numerical summary for C->Q - ANSWER Side by side box plots and descriptive statistics Visual display and numerical summary for Q->Q - ANSWER Scatterplot and correlation coefficient (r) Standard Deviation Rule - ANSWER Approximately 68% of observations fall within 1 sd of the mean, 95% within 2 sd, 99.7% (or virtually all) within 3 sds Interquartile Range (IQR) - ANSWER Middle 50% of the data IQR= Q3- Q1 Finding an outlier using IQR - ANSWER An observation is considered a suspected outlier if it is: less than Q1 - 1.5(IQR), or more than Q3 + 1.5(IQR). Interpreting scatterplots: 1. positive relationship displays as 2. negative relationship displays as - ANSWER 1. upward slope 2. downward slope
Preview 2 out of 8 pages
Exam (elaborations)
Straighterline Introduction to Statistics Exam 2023
Preview 2 out of 8 pages
Straighterline Introduction to Statistics Exam 2023..
Content preview
Document information
- Uploaded on
- April 16, 2023
- Number of pages
- 8
- Written in
- 2022/2023
- Type
- Exam (elaborations)
- Contains
- Questions & answers
$9.50
Wrong document? Swap it for free
Within 14 days of purchase and before downloading, you can choose a different document. You can simply spend the amount again.
Written by students who passed
Immediately available after payment
Read online or as PDF

Reputation scores are based on the amount of documents a seller has sold for a fee and the reviews they have received for those documents. There are three levels: Bronze, Silver and Gold. The better the reputation, the more your can rely on the quality of the sellers work.
Available in package deal
Package deal
ALL STRAIGHTERLINE CURRENT PACKAGED EXAMS WITH QUESTIONS AND VERIFIED ANSWERS 2024/2025

