1
MATH 399 Statistics
Week 4 Lab
Version 20160311
, 2
MATH399 Statistics
Week 4 Lab
Name: Brittney Andrews
Statistical Concepts:
Probability
Binomial Probability Distribution
Calculating Binomial Probabilities
Open a new Excel worksheet.
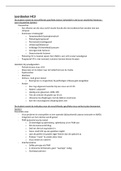
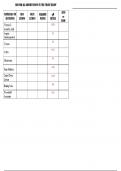
1. Open spreadsheet
2. In cell A1 type “success” as the label
3. Under that in column A, type 0 through 10 (these will be in rows 2 through 12)
4. In cell B1, type “one fourth”
5. In cell B2, type “=BINOM.DIST(A2,10,0.25,FALSE)” [NOTE: if you have
Excel 2007, then the formula is BINOMDIST without the period]
6. Then copy and paste this formula in cells B3 through B12
7. In cell C1, type “one half”
8. In cell C2, type “=BINOM.DIST(A2,10,0.5,FALSE)”
9. Copy and paste this formula in cells C3 through C12
10. In cell D1 type “three fourths”
11. In cell D2, type “=BINOM.DIST(A2,10,0.75,FALSE)”
12. Copy and paste this formula in cells D3 through D12
Plotting the Binomial Probabilities
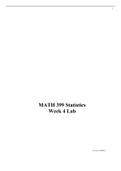
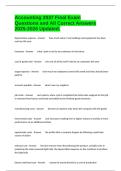
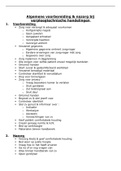
1. Create plots for the three binomial distributions above. You can create the scatter
plots in Excel by selecting the data you want plotted, clicking on INSERT, CHARTS,
SCATTER, then selecting the first chart shown which is dots with no connecting
lines. Do this two more times and for graph 2 set Y equal to ‘one half’ and X to
‘success’, and for graph 3 set Y equal to ‘three fourths’ and X to ‘success’. Paste
those three scatter plots in the grey area below. (12 points)
Version 20160311
MATH 399 Statistics
Week 4 Lab
Version 20160311
, 2
MATH399 Statistics
Week 4 Lab
Name: Brittney Andrews
Statistical Concepts:
Probability
Binomial Probability Distribution
Calculating Binomial Probabilities
Open a new Excel worksheet.
1. Open spreadsheet
2. In cell A1 type “success” as the label
3. Under that in column A, type 0 through 10 (these will be in rows 2 through 12)
4. In cell B1, type “one fourth”
5. In cell B2, type “=BINOM.DIST(A2,10,0.25,FALSE)” [NOTE: if you have
Excel 2007, then the formula is BINOMDIST without the period]
6. Then copy and paste this formula in cells B3 through B12
7. In cell C1, type “one half”
8. In cell C2, type “=BINOM.DIST(A2,10,0.5,FALSE)”
9. Copy and paste this formula in cells C3 through C12
10. In cell D1 type “three fourths”
11. In cell D2, type “=BINOM.DIST(A2,10,0.75,FALSE)”
12. Copy and paste this formula in cells D3 through D12
Plotting the Binomial Probabilities
1. Create plots for the three binomial distributions above. You can create the scatter
plots in Excel by selecting the data you want plotted, clicking on INSERT, CHARTS,
SCATTER, then selecting the first chart shown which is dots with no connecting
lines. Do this two more times and for graph 2 set Y equal to ‘one half’ and X to
‘success’, and for graph 3 set Y equal to ‘three fourths’ and X to ‘success’. Paste
those three scatter plots in the grey area below. (12 points)
Version 20160311