MATH 225N Week 6 Statistics Quiz Solutions Fall 2019 - All the Attempted Solutions Correct.
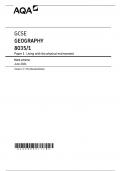
MATH 225N Week 6 Statistics Quiz Solutions Fall 2019 - All the Attempted Solutions Correct. Question 1 A statistics professor recently graded final exams for students in her introductory statistics course. In a review of her grading, she found the mean score out of 100 points was a x¯=77, with a margin of error of 10. Construct a confidence interval for the mean score (out of 100 points) on the final exam. Answer: (67, 87) Question 2 A random sample of adults were asked whether they prefer reading an e-book over a printed book. The survey resulted in a sample proportion of p′=0.14, with a sampling standard deviation of σp′=0.02, who preferred reading an e-book. Use the empirical rule to construct a 95% confidence interval for the true proportion of adults who prefer e- books. Question 3 The pages per book in a library are normally distributed with an unknown population mean. A random sample of books is taken and results in a 95% confidence interval of (237,293) pages. What is the correct interpretation of the 95% confidence interval? That is correct! We estimate with 95% confidence that the sample mean is between 237 and 293 pages. We estimate that 95% of the time a book is selected, there will be between 237 and 293 pages. We estimate with 95% confidence that the true population mean is between 237 and 293 pages. Question 4 The population standard deviation for the heights of dogs, in inches, in a city is 3.7 inches. If we want to be 95% confident that the sample mean is within 2 inches of the true population mean, what is the minimum sample size that can be taken? Round up to the nearest integer. Answer: 14 dog heights Question 5 Clarence wants to estimate the percentage of students who live more than three miles from the school. He wants to create a 98% confidence interval which has an error bound of at most 4%. How many students should be polled to create the confidence interval? z0.10 z0.05 z0.02 z0.01 z0.005 1.28 1.64 1.96 2.32 2.57 2 5 0 6 6 Use the table of values above. Question 6 The average score of a random sample of 87 senior business majors at a university who took a certain standardized test follows a normal distribution with a standard deviation of 28. Use Excel to determine a 90% confidence interval for the mean of the population. Round your answers to two decimal places and use ascending order..
Written for
- Institution
- MATH 225N
- Module
- MATH 225N
Document information
- Uploaded on
- March 3, 2023
- Number of pages
- 15
- Written in
- 2022/2023
- Type
- Exam (elaborations)
- Contains
- Questions & answers
Subjects
-
math 225n week 6 statistics quiz solutions fall 2019 all the attempted solutions correct