6.1: Statistical analysis
Arithmetic mean: measure of the central tendency of a set of data
Standard deviation: measure of the spread data around the mean
Standard error: measure of the spread of the data values around the mean for a same population
Range or interval: maximum and minimum value of a characters, where the reminder values lies
between
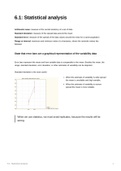
State that error bars are a graphical representation of the variability data
Error bars represent the mean and how variable data is comparable to the mean. Besides the mean, the
range, standard deviation, error deviation, or other estimates of variability can be depicted.
Standard deviation is the most useful:
When the estimate of variability is wide spread
the mean is unreliable and high variable.
When the estimate of variability is narrow
spread the mean is more reliable.
When we use statistics, we must avoid replicates, because the results will be
wrong.
6.1: Statistical analysis 1