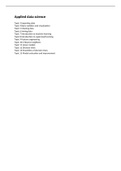
Applied data science
Topic 3 Importing data
Topic 4 Basic statistics and visualization
Topic 5 Cleaning data
Topic 6 Joining data
Topic 7 Introduction to machine learning
Topic 8 Introduction to supervised learning
Topic 9 Feature engineering
Topic 10 k-Nearest neighbors
Topic 11 Linear models
Topic 12 Decision trees
Topic 13 Ensembles of decision trees
Topic 15 Model evaluation and improvement
, Topic 3 Importing data
nieuwe naam 1 = pd.read_excel(‘bestandsnaam.xlsx’, skiprows = aantal rijen overslaan (-1),
sheet_name= ‘naam tabblad’) -> importeren van een Excel-bestand met een ander
tabblad dan de eerste en een aantal lege rijen
pivot table naam = pivot table naam [[jaartal 1, jaartal 2]] -> het filteren van kolommen (jaartallen)
uit de pivot table
, Berekenen gegeven met voorwaarde
nieuwe naam 1 = lijstnaam.loc[lijstnaam[‘kolomnaam’] == ‘voorwaarde’, :]
nieuwe naam 1[‘kolom met cijfers voor berekening’].mean()
Berekenen gegeven met twee voorwaarden
nieuwe naam 1 = lijstnaam.loc[(lijstnaam[‘kolomnaam voorwaarde 1’] == voorwaarde 1) & (lijstnaam
[‘kolomnaam voorwaarde 2’] == voorwaarde 2), :]
nieuwe naam 1[‘kolom met cijfers voor berekening’].mean()
Voor de voorwaarden geldt dat het als het tekst is tussen haakjes (‘’) geplaats moet worden, bij
getallen hoeft dit niet.
Importeren gegevens cbs
import cbsodata
nieuwe naam 1 = cbsodata.get_data(‘laatste letter en cijfer combinatie’)
, Topic 4 Basic statistics and visualization
Histogram van een kolom
DataFrame naam[‘kolomnaam’].hist(bins=aantal bins)
Boxplot van een kolom
plt.boxplot(DataFrame naam[‘kolomnaam’])
plt.show()
Scatter plot van alle gegevens
import seaborn as sns
sns.pairplot(DataFrame naam)
plt.show()
Topic 3 Importing data
Topic 4 Basic statistics and visualization
Topic 5 Cleaning data
Topic 6 Joining data
Topic 7 Introduction to machine learning
Topic 8 Introduction to supervised learning
Topic 9 Feature engineering
Topic 10 k-Nearest neighbors
Topic 11 Linear models
Topic 12 Decision trees
Topic 13 Ensembles of decision trees
Topic 15 Model evaluation and improvement
, Topic 3 Importing data
nieuwe naam 1 = pd.read_excel(‘bestandsnaam.xlsx’, skiprows = aantal rijen overslaan (-1),
sheet_name= ‘naam tabblad’) -> importeren van een Excel-bestand met een ander
tabblad dan de eerste en een aantal lege rijen
pivot table naam = pivot table naam [[jaartal 1, jaartal 2]] -> het filteren van kolommen (jaartallen)
uit de pivot table
, Berekenen gegeven met voorwaarde
nieuwe naam 1 = lijstnaam.loc[lijstnaam[‘kolomnaam’] == ‘voorwaarde’, :]
nieuwe naam 1[‘kolom met cijfers voor berekening’].mean()
Berekenen gegeven met twee voorwaarden
nieuwe naam 1 = lijstnaam.loc[(lijstnaam[‘kolomnaam voorwaarde 1’] == voorwaarde 1) & (lijstnaam
[‘kolomnaam voorwaarde 2’] == voorwaarde 2), :]
nieuwe naam 1[‘kolom met cijfers voor berekening’].mean()
Voor de voorwaarden geldt dat het als het tekst is tussen haakjes (‘’) geplaats moet worden, bij
getallen hoeft dit niet.
Importeren gegevens cbs
import cbsodata
nieuwe naam 1 = cbsodata.get_data(‘laatste letter en cijfer combinatie’)
, Topic 4 Basic statistics and visualization
Histogram van een kolom
DataFrame naam[‘kolomnaam’].hist(bins=aantal bins)
Boxplot van een kolom
plt.boxplot(DataFrame naam[‘kolomnaam’])
plt.show()
Scatter plot van alle gegevens
import seaborn as sns
sns.pairplot(DataFrame naam)
plt.show()