Horizontal analysis: analysis over time, starting with oldest.
Vertical analysis: compare outcome with industry averages or benchmark
(norm).
Vertizontal analysis: vertical + horizontal, compare with industry over the
years.
Golden Balance Rule: upper part of balance sheet, two ratios with five norms.
Two ratios are always complementary, sometimes contradictionary.
Growth Working Capital Ratio: current assets should be 130% bigger
than current liabilities (Z-curve), conservative financial structure. If you
have more current assets you are more liquid.
Golden Balance Rule Ratio: four norms:
o Absolute norm: 0<GBR−R<1 , not possible to have negative
balance sheet items (except for equity). So GBR-R will be negative if
equity is more negative than sum of provisions, LT liabilities, and
shareholders’ equity (technical bankruptcy really bankrupt if not
liquid anymore).
GBR−R>1 : illiquidity (worse than technical bankruptcy).
o Favorite range: 0.5<GBR−R<0.8
0−0.5 : over liquidity, too much liquidity.
0.8−1 : entering illiquidity.
Growth Current Assets ¿ 1.3
Working Current Liabilities
Capital Ratio
Golden Balance ¿ Assets Absolute:
Rule Equity + Provisions+ Non−Current Liabilities 0<GBR−R<1
Favorite:
0.5<GBR−R<0.8
NWC: Current Assets−Current Liabilities , should always be positive.
Autonomous: cash, banking loans.
Inherent/induced: sticky to the business, inventories, accounts
receivable, prepayments, accruals, accounts payable.
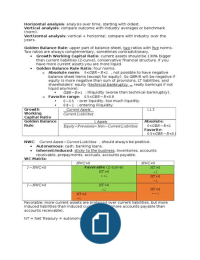
WC Matrix:
NWC >0 NWC<0
I −NWC<0 Favorable (Z-curve) NT >0
NT >0 +¿
++¿ NT <0
−¿
I −NWC>0 NT >0
+¿ NT <0
NT <0 −−¿
−¿
Favorable: more current assets are preferred over current liabilities, but more
induced liabilities than induced current assets (more accounts payable than
accounts receivable).
NT = Net Treasury = autonomous NWC.
, Current Ratio Current Assets ¿ 1.3
(3rd grade Current Liabilities
liquidity)
Quick Ratio (2nd Current Assets−Inventory ¿1
grade liquidity) Current Liabilities
Cash Ratio (1st Deposits+Cash ¿ 0.2
grade liquidity) Current Liabilities
Financials should always start with 1st grade liquidity and then calculate bottom
up.
Situation: Cash Ratio<0.2 calculate lack of 1st grade liquidity (
0.2−outcome Cash Ratio ). Quick Ratio>1−lack of 1st grade liquidity (since not
allowed to make tradeoff). Only deduct if there’s shortage.
st
Current Ratio >1.3−lack of 1 grade liquidity . Only deduct Cash Ratio.
Why Cash Ratio > 0.2? Ratio is for all branches/industries, every company.
1. Risk mitigation (buffer).
2. Sinking fund for investments (CAPEX, PPE).
3. Opportunity reason in order to make quick moves.
4. Hostile takeover; can’t be planned easily.
Loan-to-Deposit Financial Cushion Deposits+Cash ¿ 0.5
Ratio (L-t-D)
=
Autonomous ST Liabilities Autonomous ST Liabilities
Capital ¿ Assets+ Induced /Trade NWC+ Financial Cushion
Employed
Return on EBIT ¿ 16 >WACC
Capital ¿ Assets+ Induced/ Trade NWC + Financial Cushion
Employed
(ROCE)
Return on Net Net Earnings
Assets (RONA) ¿ Assets+ NWC
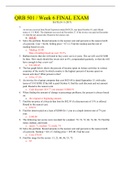
Cash conversion cycle (days working capital):
Purchase markets: Starbucks:
1. Primary process: coffee,
water, cups, tea
2. Secondary process: toilet
paper, insurance, printer,
fees.
Stock-to-fulfill:
1. Parts
2. Finished goods
Production-to-stock: all pieces/materials in machines in order to produce.
Cash doesn’t flow in same pace as products. There might be an abundance or
shortage of cash capital markets.
Days working capital (DWC): days cash is traveling through induced process
of CCC (90 days), take average figures of balance sheet if possible:
Vertical analysis: compare outcome with industry averages or benchmark
(norm).
Vertizontal analysis: vertical + horizontal, compare with industry over the
years.
Golden Balance Rule: upper part of balance sheet, two ratios with five norms.
Two ratios are always complementary, sometimes contradictionary.
Growth Working Capital Ratio: current assets should be 130% bigger
than current liabilities (Z-curve), conservative financial structure. If you
have more current assets you are more liquid.
Golden Balance Rule Ratio: four norms:
o Absolute norm: 0<GBR−R<1 , not possible to have negative
balance sheet items (except for equity). So GBR-R will be negative if
equity is more negative than sum of provisions, LT liabilities, and
shareholders’ equity (technical bankruptcy really bankrupt if not
liquid anymore).
GBR−R>1 : illiquidity (worse than technical bankruptcy).
o Favorite range: 0.5<GBR−R<0.8
0−0.5 : over liquidity, too much liquidity.
0.8−1 : entering illiquidity.
Growth Current Assets ¿ 1.3
Working Current Liabilities
Capital Ratio
Golden Balance ¿ Assets Absolute:
Rule Equity + Provisions+ Non−Current Liabilities 0<GBR−R<1
Favorite:
0.5<GBR−R<0.8
NWC: Current Assets−Current Liabilities , should always be positive.
Autonomous: cash, banking loans.
Inherent/induced: sticky to the business, inventories, accounts
receivable, prepayments, accruals, accounts payable.
WC Matrix:
NWC >0 NWC<0
I −NWC<0 Favorable (Z-curve) NT >0
NT >0 +¿
++¿ NT <0
−¿
I −NWC>0 NT >0
+¿ NT <0
NT <0 −−¿
−¿
Favorable: more current assets are preferred over current liabilities, but more
induced liabilities than induced current assets (more accounts payable than
accounts receivable).
NT = Net Treasury = autonomous NWC.
, Current Ratio Current Assets ¿ 1.3
(3rd grade Current Liabilities
liquidity)
Quick Ratio (2nd Current Assets−Inventory ¿1
grade liquidity) Current Liabilities
Cash Ratio (1st Deposits+Cash ¿ 0.2
grade liquidity) Current Liabilities
Financials should always start with 1st grade liquidity and then calculate bottom
up.
Situation: Cash Ratio<0.2 calculate lack of 1st grade liquidity (
0.2−outcome Cash Ratio ). Quick Ratio>1−lack of 1st grade liquidity (since not
allowed to make tradeoff). Only deduct if there’s shortage.
st
Current Ratio >1.3−lack of 1 grade liquidity . Only deduct Cash Ratio.
Why Cash Ratio > 0.2? Ratio is for all branches/industries, every company.
1. Risk mitigation (buffer).
2. Sinking fund for investments (CAPEX, PPE).
3. Opportunity reason in order to make quick moves.
4. Hostile takeover; can’t be planned easily.
Loan-to-Deposit Financial Cushion Deposits+Cash ¿ 0.5
Ratio (L-t-D)
=
Autonomous ST Liabilities Autonomous ST Liabilities
Capital ¿ Assets+ Induced /Trade NWC+ Financial Cushion
Employed
Return on EBIT ¿ 16 >WACC
Capital ¿ Assets+ Induced/ Trade NWC + Financial Cushion
Employed
(ROCE)
Return on Net Net Earnings
Assets (RONA) ¿ Assets+ NWC
Cash conversion cycle (days working capital):
Purchase markets: Starbucks:
1. Primary process: coffee,
water, cups, tea
2. Secondary process: toilet
paper, insurance, printer,
fees.
Stock-to-fulfill:
1. Parts
2. Finished goods
Production-to-stock: all pieces/materials in machines in order to produce.
Cash doesn’t flow in same pace as products. There might be an abundance or
shortage of cash capital markets.
Days working capital (DWC): days cash is traveling through induced process
of CCC (90 days), take average figures of balance sheet if possible: