25) On a coordinate graph with y on the vertical axis and x on the horizontal axis, suppose point A
represents co-ordinates (x = 2, y = 16) and point B represents coordinates (x = 10, y = 4). What is the slope
of the straight line joining points A and B?
A) 0.75
B) -0.75
C) 1.5
D) -1.5
E) -0.43
Answer: D
Diff: 3
Topic: 2.4b. graphing linear functions
Skill: Applied
Learning Obj.: 2-5 See that the slope of a line on a graph relating two variables shows the "marginal response" of one
variable to a change in the other.
User2: Quantitative
26) Suppose Ahmoud would spend $1200 per year on travel, even if his annual income were zero. As his
income rises, he would spend 20% of each additional dollar of income on travel. Choose the correct
mathematical equation that describes the functional relation between his travel spending (T) and his
income (Y).
A) Y = 1200 + 0.2T
B) Y = 1200 - 0.2T
C) T = 0.2 + 1200Y
D) T = 1200 + 0.8Y
E) T = 1200 + 0.2Y
Answer: E
Diff: 3
Topic: 2.4b. graphing linear functions
Skill: Applied
Learning Obj.: 2-5 See that the slope of a line on a graph relating two variables shows the "marginal response" of one
variable to a change in the other.
User2: Quantitative
27) Suppose that over a 12-month period, Sonali's income (Y) rises from $27 000 to $35 000 per year and, as
a result, her spending on travel (T) increases from $1500 to $2500 per year. Assume there is a linear
relation between the two variables, Y and T. What is the marginal response in T to a change in Y?
A) 8
B) 4
C) 0
D) 0.25
E) 0.125
Answer: E
Diff: 3
Topic: 2.4b. graphing linear functions
Skill: Applied
Learning Obj.: 2-5 See that the slope of a line on a graph relating two variables shows the "marginal response" of one
variable to a change in the other.
User2: Quantitative
, 28) Suppose there is a linear relationship between the ticket price (P) to a university basketball game and
the number of tickets sold (Q). If the ticket price is $20, then 600 tickets are sold; if the ticket price is $8,
then $3000 tickets are sold. What is the slope of the function if Q is plotted on the horizontal axis and P is
plotted on the vertical axis?
A) -0.005
B) -0.05
C) 0
D) 0.05
E) 0.005
Answer: A
Diff: 3
Topic: 2.4b. graphing linear functions
Skill: Applied
Learning Obj.: 2-5 See that the slope of a line on a graph relating two variables shows the "marginal response" of one
variable to a change in the other.
User2: Quantitative
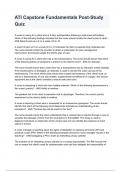
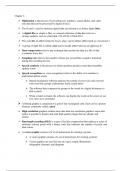
FIGURE 2-2
29) Refer to Figure 2-2. The slope of curve A is
A) positive and constant.
B) negative and constant.
C) positive and changing.
D) negative and changing.
E) undefined.
Answer: B
Diff: 1
Topic: 2.4b. graphing linear functions
Skill: Applied
Learning Obj.: 2-5 See that the slope of a line on a graph relating two variables shows the "marginal response" of one
variable to a change in the other.
User1: Graph
User2: Qualitative
30) Refer to Figure 2-2. The slope of curve B is
A) positive and constant.
B) negative and constant.
C) positive and changing.
represents co-ordinates (x = 2, y = 16) and point B represents coordinates (x = 10, y = 4). What is the slope
of the straight line joining points A and B?
A) 0.75
B) -0.75
C) 1.5
D) -1.5
E) -0.43
Answer: D
Diff: 3
Topic: 2.4b. graphing linear functions
Skill: Applied
Learning Obj.: 2-5 See that the slope of a line on a graph relating two variables shows the "marginal response" of one
variable to a change in the other.
User2: Quantitative
26) Suppose Ahmoud would spend $1200 per year on travel, even if his annual income were zero. As his
income rises, he would spend 20% of each additional dollar of income on travel. Choose the correct
mathematical equation that describes the functional relation between his travel spending (T) and his
income (Y).
A) Y = 1200 + 0.2T
B) Y = 1200 - 0.2T
C) T = 0.2 + 1200Y
D) T = 1200 + 0.8Y
E) T = 1200 + 0.2Y
Answer: E
Diff: 3
Topic: 2.4b. graphing linear functions
Skill: Applied
Learning Obj.: 2-5 See that the slope of a line on a graph relating two variables shows the "marginal response" of one
variable to a change in the other.
User2: Quantitative
27) Suppose that over a 12-month period, Sonali's income (Y) rises from $27 000 to $35 000 per year and, as
a result, her spending on travel (T) increases from $1500 to $2500 per year. Assume there is a linear
relation between the two variables, Y and T. What is the marginal response in T to a change in Y?
A) 8
B) 4
C) 0
D) 0.25
E) 0.125
Answer: E
Diff: 3
Topic: 2.4b. graphing linear functions
Skill: Applied
Learning Obj.: 2-5 See that the slope of a line on a graph relating two variables shows the "marginal response" of one
variable to a change in the other.
User2: Quantitative
, 28) Suppose there is a linear relationship between the ticket price (P) to a university basketball game and
the number of tickets sold (Q). If the ticket price is $20, then 600 tickets are sold; if the ticket price is $8,
then $3000 tickets are sold. What is the slope of the function if Q is plotted on the horizontal axis and P is
plotted on the vertical axis?
A) -0.005
B) -0.05
C) 0
D) 0.05
E) 0.005
Answer: A
Diff: 3
Topic: 2.4b. graphing linear functions
Skill: Applied
Learning Obj.: 2-5 See that the slope of a line on a graph relating two variables shows the "marginal response" of one
variable to a change in the other.
User2: Quantitative
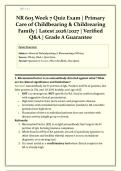
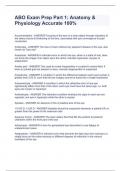
FIGURE 2-2
29) Refer to Figure 2-2. The slope of curve A is
A) positive and constant.
B) negative and constant.
C) positive and changing.
D) negative and changing.
E) undefined.
Answer: B
Diff: 1
Topic: 2.4b. graphing linear functions
Skill: Applied
Learning Obj.: 2-5 See that the slope of a line on a graph relating two variables shows the "marginal response" of one
variable to a change in the other.
User1: Graph
User2: Qualitative
30) Refer to Figure 2-2. The slope of curve B is
A) positive and constant.
B) negative and constant.
C) positive and changing.