Eric Asare unit 3 m2
Demonstrate the impact of changing cost and revenue data on the break-even
Point of your business. Explain how you can reduce the break-even point and
maximise the profit of your business?
Evidence
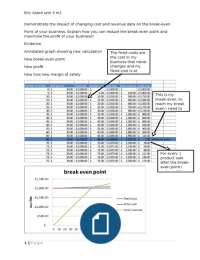
Annotated graph showing new calculation The fixed costs are
the cost in my
New break-even point
business that never
New profit changes and my
fixed cost is at
New loss new margin of safety
This is my
break-even, to
reach my break
even I need to
For every 1
product sale
after the break-
even point I
make a £29
1 | Page
, Eric Asare unit 3 m2
By decreasing the fixed cost my break-even also decreased making it easier to
reach the break-even. The reason why I decreased my break-even is because it
saves me money and it made me reach my break-even point a faster so that I
can focus on making profit
This arrow points
at the break-even
point in the chart.
Margin
of safety
This is my changed
The chart shows that
chart. This shows
the lower your fixed
the breakeven point
cost is, the higher your
has dropped on this
profit. I know this
chart then the
because in my previous
pervious and this
chart it shows the
chart has a same
break-even point was
pattern as the
high and the profit was
pervious chart but
2 | Page
Demonstrate the impact of changing cost and revenue data on the break-even
Point of your business. Explain how you can reduce the break-even point and
maximise the profit of your business?
Evidence
Annotated graph showing new calculation The fixed costs are
the cost in my
New break-even point
business that never
New profit changes and my
fixed cost is at
New loss new margin of safety
This is my
break-even, to
reach my break
even I need to
For every 1
product sale
after the break-
even point I
make a £29
1 | Page
, Eric Asare unit 3 m2
By decreasing the fixed cost my break-even also decreased making it easier to
reach the break-even. The reason why I decreased my break-even is because it
saves me money and it made me reach my break-even point a faster so that I
can focus on making profit
This arrow points
at the break-even
point in the chart.
Margin
of safety
This is my changed
The chart shows that
chart. This shows
the lower your fixed
the breakeven point
cost is, the higher your
has dropped on this
profit. I know this
chart then the
because in my previous
pervious and this
chart it shows the
chart has a same
break-even point was
pattern as the
high and the profit was
pervious chart but
2 | Page